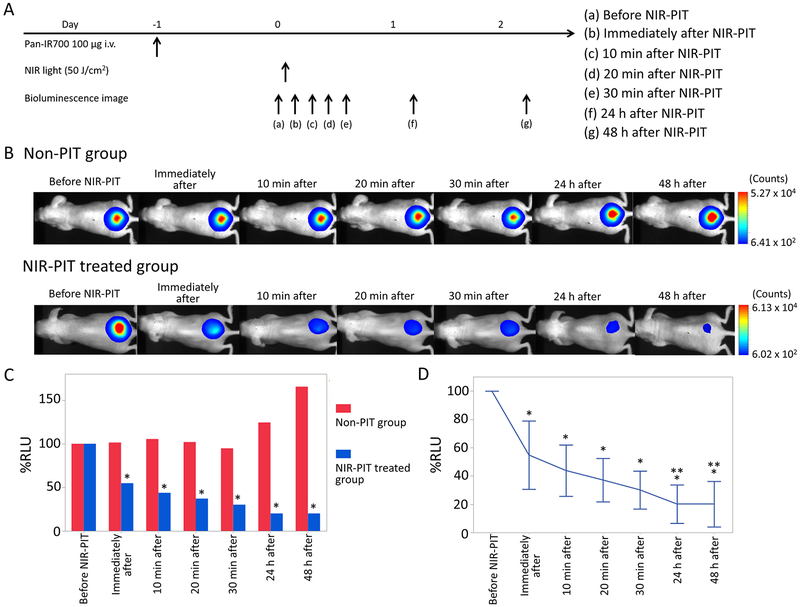
Figure 3.
Luciferase–luciferin photon-counting imaging in response to NIR-PIT. (A) NIR-PIT outline. Luciferase–luciferin photon-counting images were scanned at each time point as shown. (B) Luciferase–luciferin photon-counting real-time images of A431-luc-GFP tumor bearing mice for NIR-PIT. Yellow arrows indicate the tumor. Luciferase activity continued to decrease in the early phase (0, 10, 20, 30 min later) after NIR-PIT. Luciferase activity in the late phase (24 and 48 h later) was lower than that 30 min after NIR-PIT. (C) Comparison of luciferase activity in A431-luc-GFP tumor bearing mice between non-PIT and NIR-PIT treated groups. %RLU in the NIR-PIT group showed significant decreases at each time point after NIR-PIT compared with that in the non-PIT group (*p < 0.05, vs non-PIT group, Mann–Whitney U-test). (D) Time course analysis of luciferase activity in the NIR-PIT treated group. %RLU at each time point after NIR-PIT showed significant decreases in comparison with pretreatment %RLU (*p < 0.05, vs pretreatment %RLU, paired t-test). Additionally, %RLU 24 and 48 h after NIR-PIT showed significant decreases in comparison with %RLU 30 min after NIR-PIT, respectively (**p < 0.05, vs %RLU 30 min after NIR-PIT, paired t-test).

