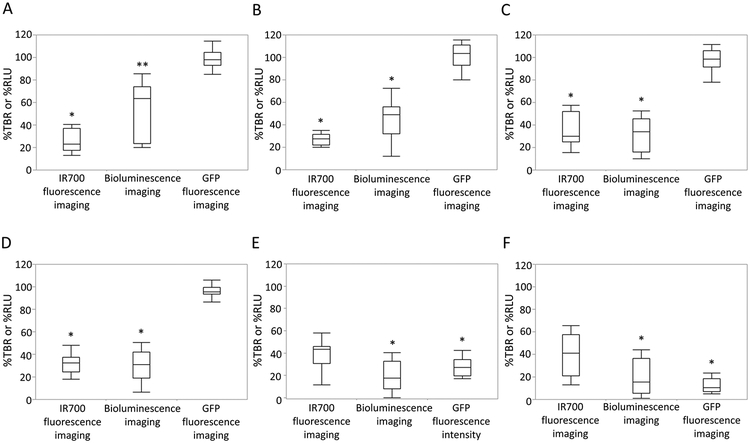
Figure 5.
Comparison of signal intensity after NIR-PIT among IR700 fluorescence imaging, luciferase–luciferin photon-counting imaging, and GFP fluorescence imaging. (A) Difference in signal intensity immediately after NIR-PIT. %TBRIR700 was significantly lower than %RLU (*p < 0.05, vs RLU ratio, paired t-test), and %RLU was significantly lower than %TBRGFP (**p < 0.05, vs %TBRGFP, paired t-test). (B) Difference in signal intensity 10 min after NIR-PIT. %TBRIR700 and %RLU were significantly lower than %TBRGFP, respectively (*p < 0.05, vs %TBRGFP, paired t-test). (C) Difference in signal intensity 20 min after NIR-PIT. %TBRIR700 and %RLU were significantly lower than %TBRGFP, respectively (*p < 0.05, vs % TBRGFP, paired t-test). (D) Difference in signal intensity 30 min after NIR-PIT. %TBRIR700 and %RLU were significantly lower than %TBRGFP, respectively (*p < 0.05, vs %TBRGFP, paired t-test). (E) Difference in signal intensity 24 h after NIR-PIT. %RLU and %TBRGFP were significantly lower than %TBRIR700, respectively (*p < 0.05, vs %TBRIR700, paired t-test). (F) Difference in signal intensity 48 h after NIR-PIT. %RLU and % TBRGFP were significantly lower than %TBRIR700, respectively (*p < 0.05, vs %TBRIR700, paired t-test).

