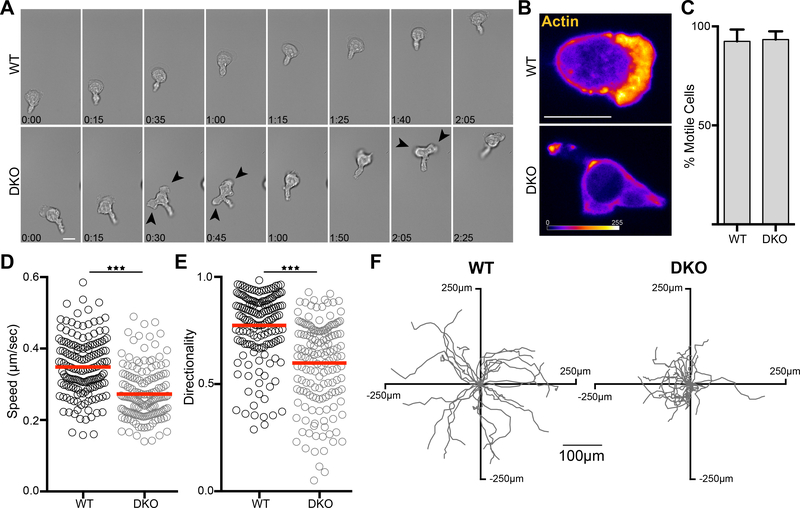
Figure 2. Crk proteins are required for leading edge formation and normal migration.
A) CD4+ T cells were allowed to adhere to ICAM-1 coated coverslips for 20 mins, washed, and time-lapse images were taken of migrating cells using DIC optics. Scale bar, 10μm. (see movies S1 and S2). Darts highlight multiple cell protrusions. B) CD4+ T cells expressing Lifeact-GFP were treated as in (A) and time-lapse images were taken using confocal microscopy. Images are a projection of a 1μm total stack at the coverslip interface, with Lifeact-GFP intensity represented by a heat map. Scale bar, 10μm. (see Supplemental Movies 3 and 4). C-F) CD4+ T cells were treated as in (A) and tracked over a 10 min period using DIC optics. C) Percentage of adhered T cells that were migratory. Data are mean +/− SD from 3 experiments. D) Average speed and E) Directionality of migrating T cells, calculated as net displacement divided by track length. Data were pooled from 4 experiments. F) Tracks from a single experiment of individual migrating T cells centered at the same starting point. *p<0.05; **p<0.01; ***p<0.001 by a t-test.

