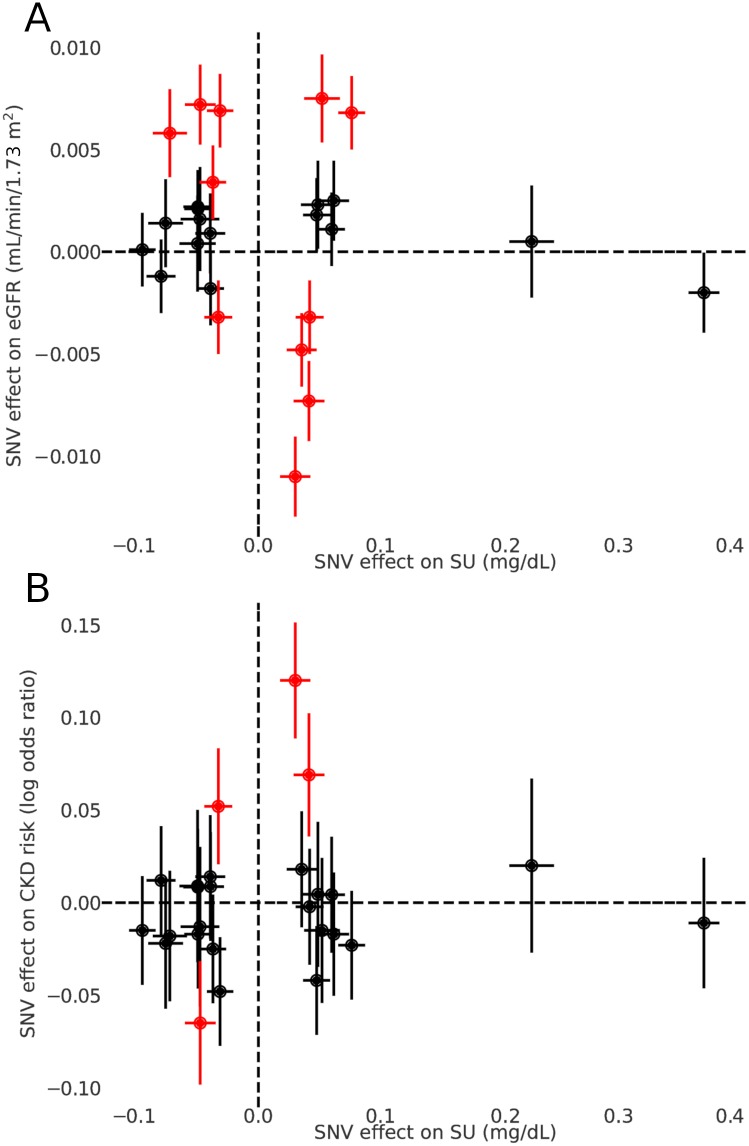
Fig 3. Effects of individual SNVs on SU, eGFR, and CKD.
Effects of individual SNVs on SU (x-axis, both panels), eGFR (y-axis, A), and CKD (y-axis, B), as estimated by the respective genome-wide association meta-analyses. Error bars indicate 95% confidence intervals. SNVs identified as outliers by the MR-PRESSO outlier test are highlighted in red. CKD, chronic kidney disease; MR, Mendelian randomization; SNV, single nucleotide variant; SU, serum urate.

