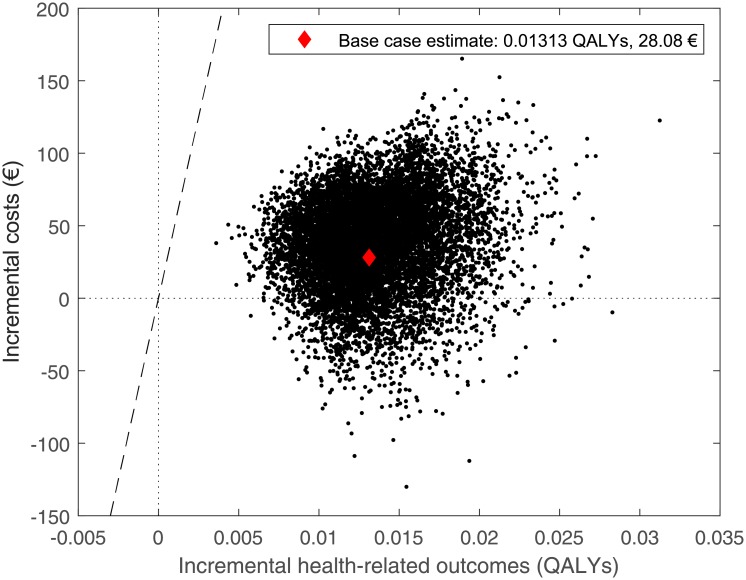
Fig 4. Scatter plot depicting the incremental health-related outcomes and costs of strategy ‘TRS & GRS optimized’ versus strategy ‘No treatment’ derived from the Monte Carlo (probabilistic) sensitivity analysis.
Each dot represents the incremental health-related outcomes and costs of one sample (i.e., the population-weighted averages). Strategy ‘TRS & GRS optimized’ was optimized for each set of sampled parameter values using the willingness-to-pay threshold of 50,000 €/QALY.

