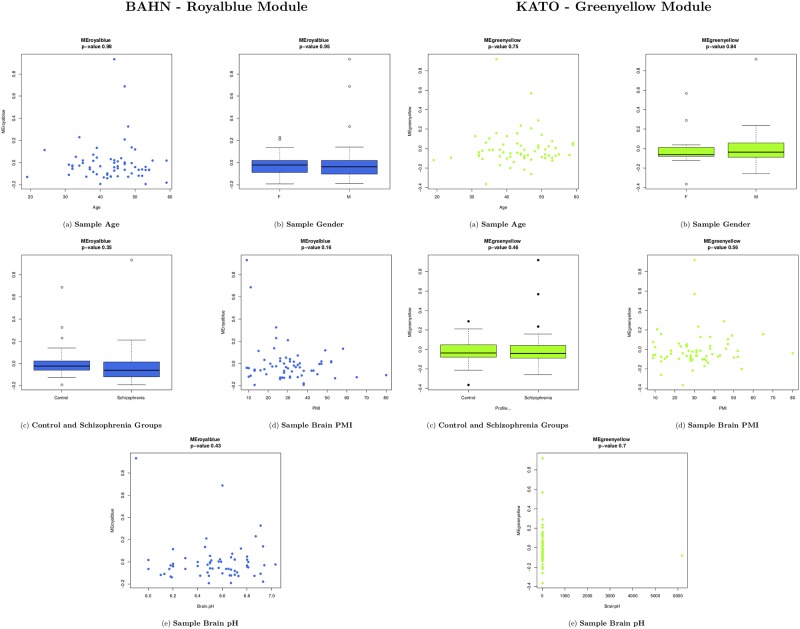
Fig 2. Correlation between BAHN and KATO least preserved module (Royalblue and Greenyellow, respectively) kME and sample traits, using LME model.
In both results, Age (a), Gender (b), Disease (c), PMI (d) and brain pH (e). In all subfigures, the kME M value are inserted on y-axis and the sample trait, on x-axis.

