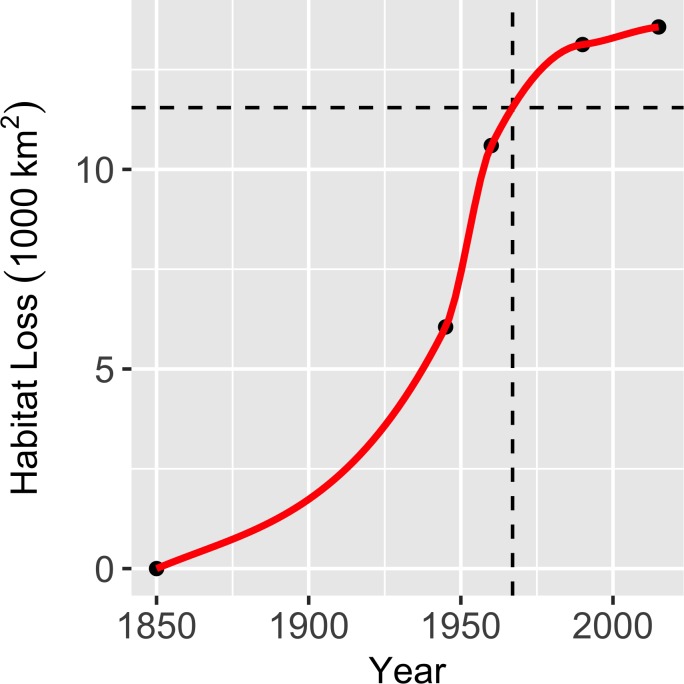
Fig 3. Area of Gambelia sila habitat converted to agricultural and urban development over time.
Points are derived from the intersection of historical land use maps and predicted historical distribution. The red line is interpolated with LOESS regression. Dashed lines correspond to the year 1967, when the species became federally protected.

