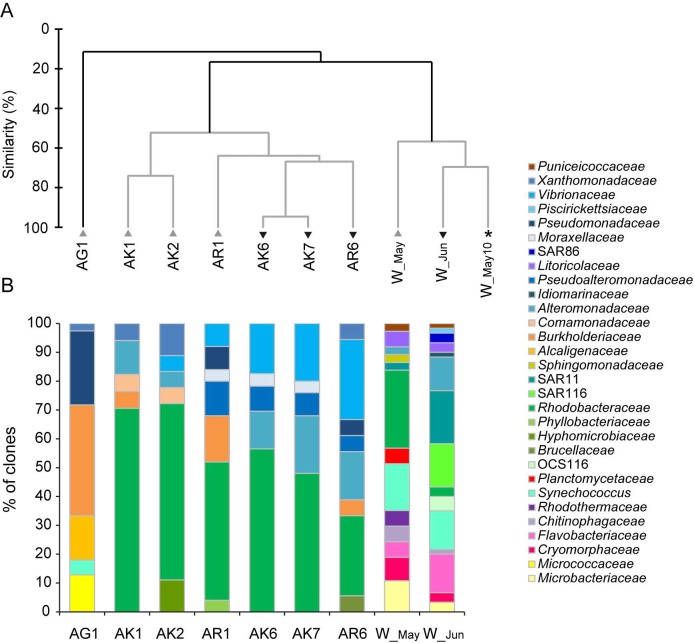
Fig 2. Bacterial community composition at the bacterial family level.
(A) Cluster analysis based on bacterial community composition at the family level. AK-jellyfish exumbrella surface, AR-jellyfish oral arms, AG-mucus from gastral cavity and W-ambient seawater. Samples were collected in May (grey triangles) and June (inverted black triangles). Asterisk mark the additional water sample collected in May 2010 in the Gulf of Trieste. The dendrogram was inferred with the group average algorithm, based on the Bray–Curtis similarity matrix of arcsine transformed averaged abundances. The grey branches do not differ significantly (SIMPROF test, p> 0.05). (B) The dynamic of bacterial families within bacterial phyla and Proteobacteria class. Cumulative column charts represent relative abundances of bacterial families. Jellyfish exumbrella surface samples (AK1, AK2), oral arms sample (AR1), mucus sample from gastral cavity (AG1), ambient seawater (W_May) collected in May and jellyfish exumbrella surface samples (AK6, AK7), oral arms sample (AR6), and the ambient seawater sample (W_Jun) collected in June.

