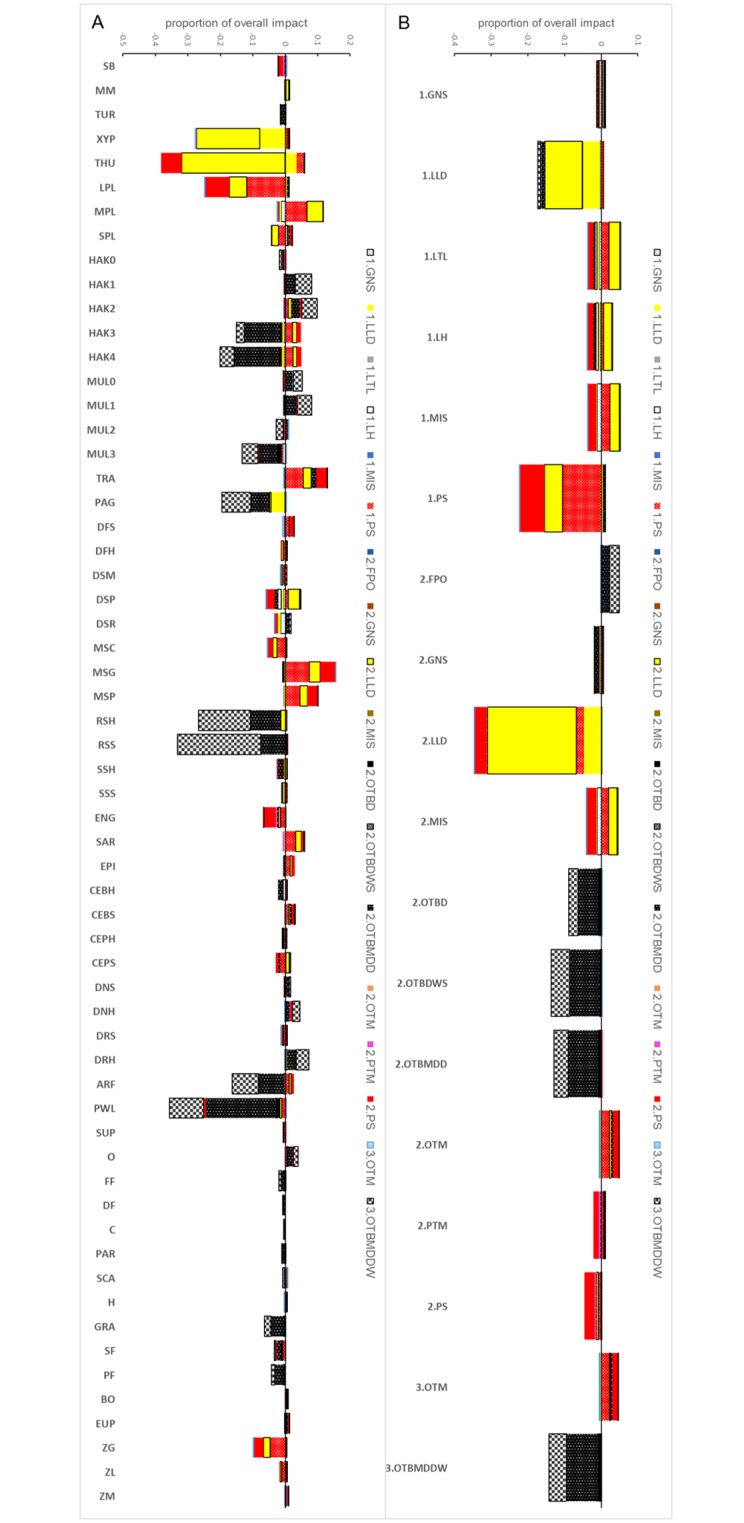
Fig 8. Results of the MTI analysis for fleets of the SoS ecosystem model.

(A) overall impact across biological functional groups. (B) conflicts (negative values of MTI) and benefits (positive values of MTI) among fleet segments.

(A) overall impact across biological functional groups. (B) conflicts (negative values of MTI) and benefits (positive values of MTI) among fleet segments.