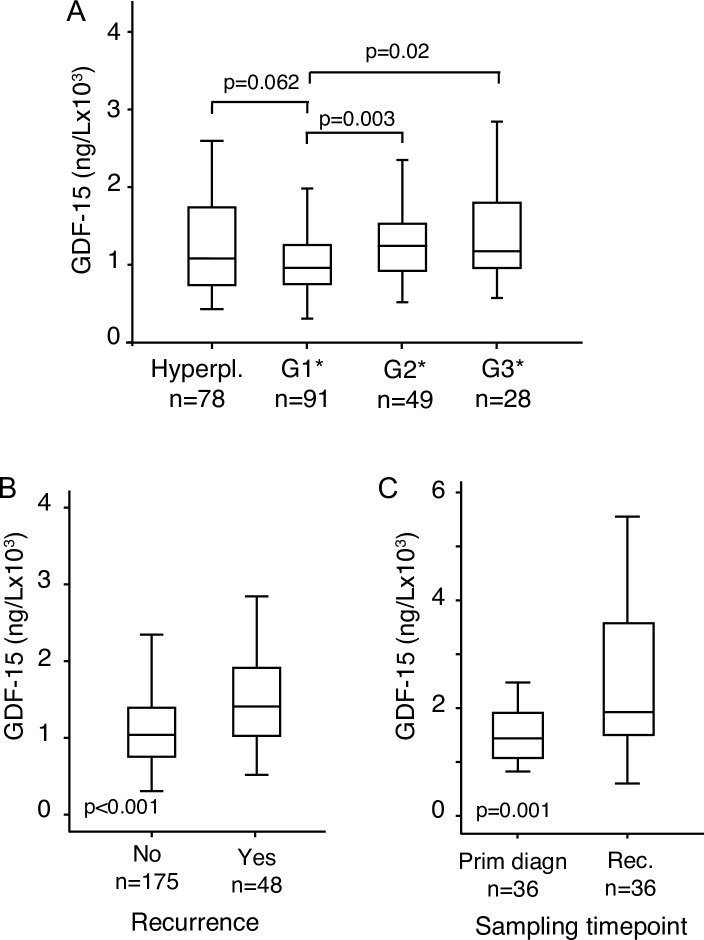
Fig 2.
Box plots showing plasma level of GDF-15 in hyperplasias and grade 1–3 (A), in patients who experienced recurrence during their follow-up and in patients who did not (B) and plasma level of GDF-15 in paired samples at time of primary diagnosis and at time of recurrence (C). Number of cases are given. P-values are calculated by the Mann Whitney U test in independent samples and Wilcoxon Signed Rank test in related samples. *Endometrioid included only.

