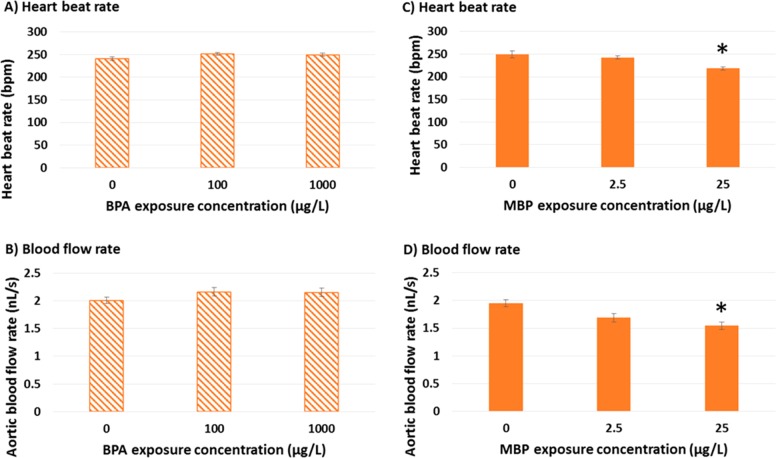
Figure 3.
Effects of BPA and MBP exposure on cardiovascular function in zebrafish larvae at 15 days post fertilization (dpf) Hatched bar charts (A-B) represent BPA, solid bar charts (C–D) represent MBP. Data represent six individual fish taken randomly from each of six separate aquaria (n = 6 experimental replicates) per exposure treatment. Bar heights represent means, error bars represent 95% confidence intervals. Significant differences from 0 μg/L solvent control (p > 0.05) are highlighted with an asterisk.

