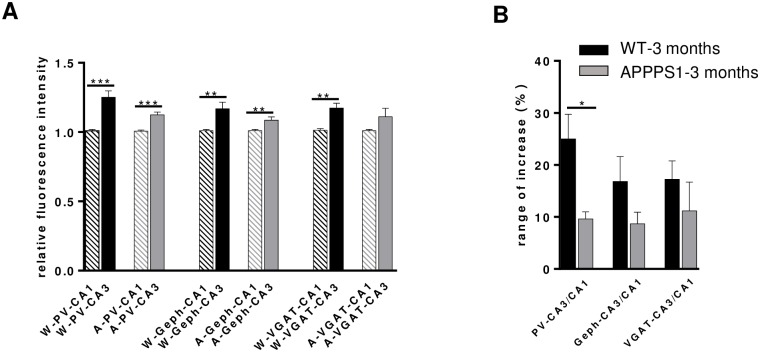
Fig 3. Subregional differences in the immunoreactivity of PV and inhibitory synaptic proteins in the hippocampus of 3-month-old WT and APPPS1 mice.
(A): Graphs show in comparison the immunofluorescence intensities measured for PV, Geph and VGAT in CA1 and CA3 subfields of WT and APPPS1 hippocampus, respectively. The immunoreactivity of all three antigens is higher in CA3 than in CA1 both in WT and APPPS1 mice. However, the rate of increase in CA3 vs CA1 is significantly higher in APPPS1 hippocampus (B). The interregional difference CA3 vs CA1 in PV-, Geph- and VGAT-immunoreactivity in WT and APPPS1 hippocampus is given as percent (%) when CA1 was set as 100% (n = 4–5 animals/group; means +/- SEM; *p < 0.05).

