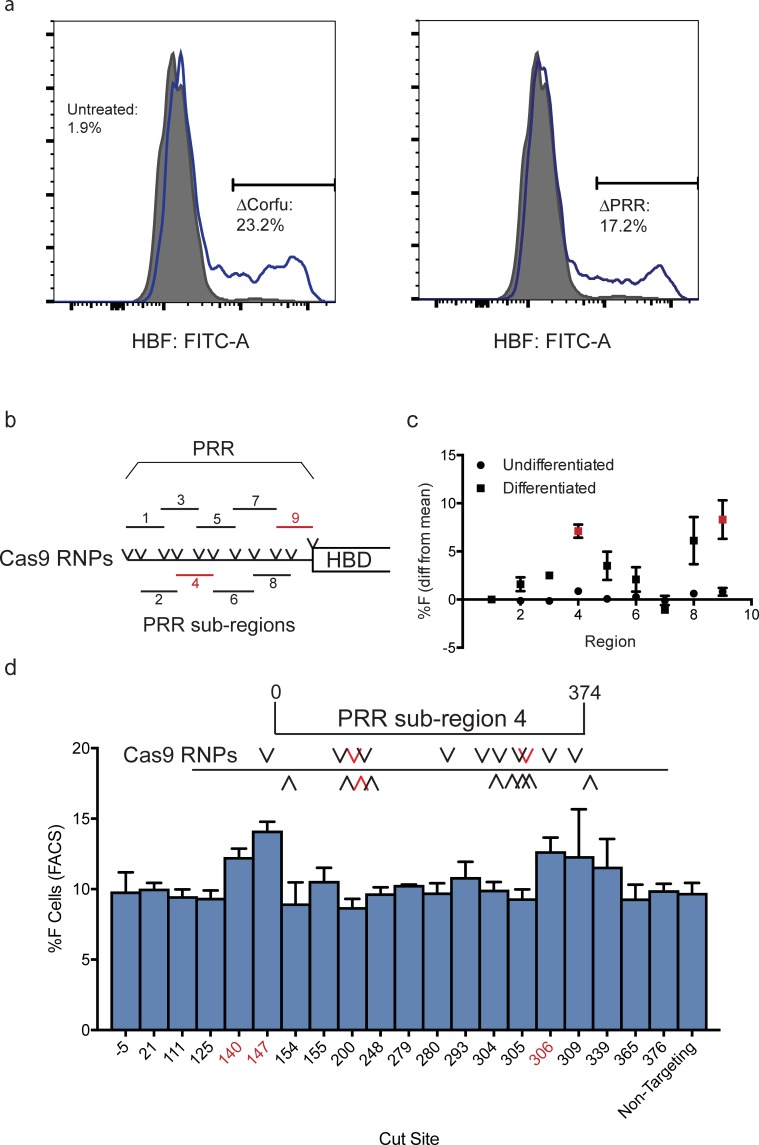
Fig 2. Interrogation of the PRR in the parent HUDEP-2 cell line.
A) Representative intracellular FACS plots showing a population of HbF-expressing HUDEP-2 cells, after electroporation of RNP pairs generating each deletion and differentiation into erythrocytes. B) Schematic depicting the PRR, divided into 9 overlapping sub-regions. Deletion of each sub-region is programmed by a pair of RNPs. Sub-region deletions leading to statistically significant increase in HbF expression are marked in red. C) Flow cytometry enumeration of HbF-expressing HUDEP-2 cells after introduction of Cas9 RNPs driving deletion of each sub-region, before and after differentiation into erythroblasts. Results are (mean of each culture)-(mean of all cultures) ± s.d. for 3 biological replicates, regions 4 and 9 (in red) deletion led to a statistically significant increase in HbF expressing cells, compared to the mean of all cultures. D) Scanning mutagenesis screen using 20 separate Cas9 RNPs targeting every PAM in region 4 to differentiated HUDEP-2 cells, with HbF-expressing cells enumerated by flow cytometry. Each RNP is denoted by its cut site within the PRR region 4, from -4 (4 nt upstream of the 5’ region breakpoint) to 376 (376 nt downstream of the 5’ region breakpoint). To ensure consistency, synthetic RNAs were used. Results are mean ± s.d. for 3 biological replicates. Statistically significant sites are marked in red.

