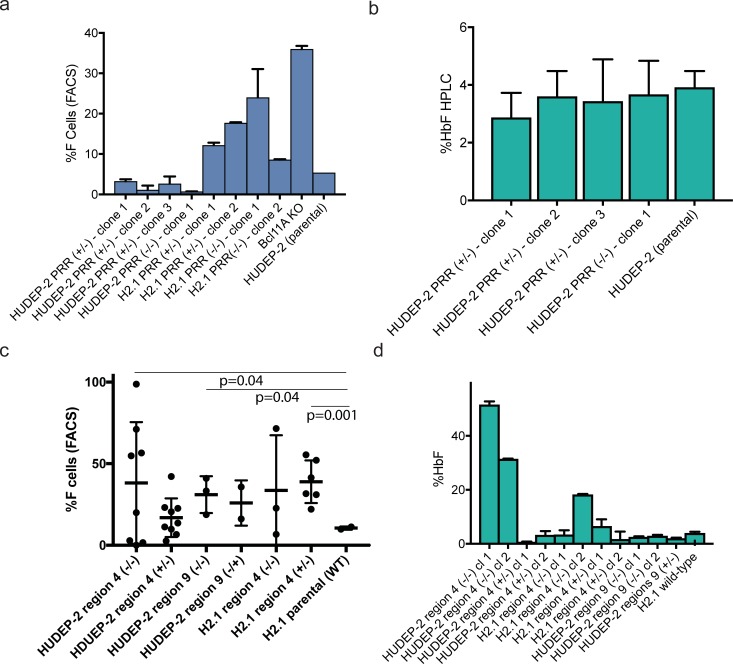
Fig 3. Interrogation of HUDEP-2 and H2.1 cell clones carrying deletions of the PRR and selected sub-regions.
A) Proportion of HbF-expressing cells assayed by flow cytometry in cell clones carrying the indicated PRR deletions (mean ± s.d. of 3 biological replicates). B) Quantitation of HbF expression by HPLC in selected clones carrying the indicated PRR deletions, (mean ± s.d. of 3 technical replicates). No significant differences in HbF expression were seen in comparison to parent HUDEP-2 cells. C) Expression of HbF in clonal cell lines carrying the indicated sub-region deletions, measured by flow cytometry, error bars represent mean ± s.d. of 2–8 independently-derived clones for each genotype. Clones with statistically significant differences in HbF-expressing cells compared to unedited H2.1 cells are noted (unpaired t-test). D) Expression of HbF in selected clonal cell lines carrying the indicated sub-region deletions, measured by hemoglobin HPLC Each bar represents the mean ± s.d. of 3 technical replicates for each clone. Phenotypic information for each clone is in Table a in S1 File.

