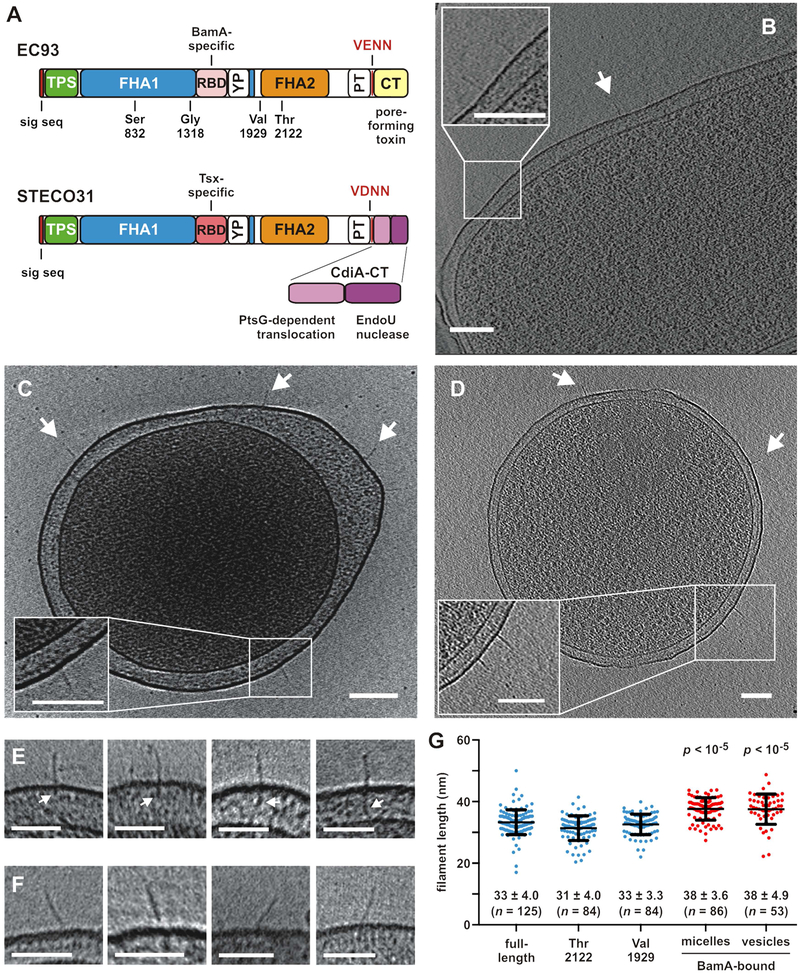
Figure 1. CdiA forms a filament on the cell surface.
A) CdiA domain architecture. VENN/VDNN motifs demarcating the CdiA-CT regions are indicated. The YP domain is not annotated in current databases. See Figure S3. B) CdiAEC93 on the cell surface. See Figure S1B & Movie S1. C) CdiAEC93 on an E. coli minicell. See Figure S1C & Movie S2. D) CdiASTECO31 on an E. coli minicell. See Movie S3. Arrows indicate individual CdiA proteins, and scale bars = 100 nm for A, B & C. E) Periplasmic densities associated with filaments. F) Angled filaments. Scale bars = 50 nm for E & F. G) Lengths of CdiAEC93 filaments. Data are presented with mean ± SD for each condition. The p values are from twotailed t-test comparisons with full-length CdiAEC93.

