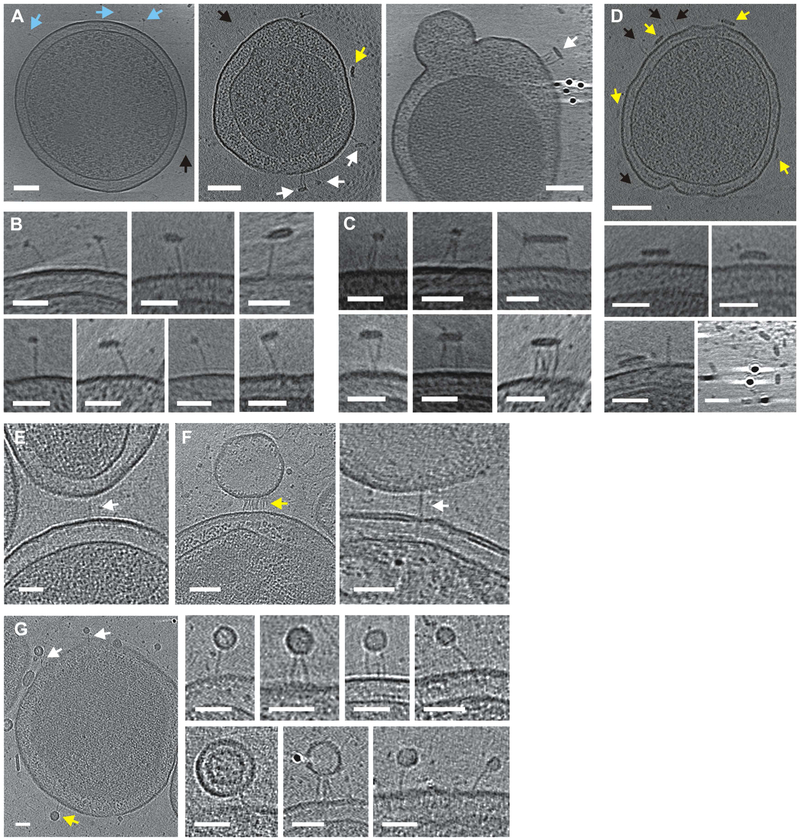
Figure 3. CdiA-receptor binding interactions.
A) CdiAEC93 bound to solubilized BamA in globular (blue arrows) and flattened micelles (white arrows). See Movie S5. Some filaments (black arrows) and micelles (yellow arrows) do not interact. B) Enlarged views of BamA-bound filaments. C) Micelles bound to multiple filaments. D) CdiAEC93 expressing minicell incubated with detergent in buffer. E) CdiAEC93 filament bridging minicells. F) Filaments bound to vesicles from BamA-expressing minicells. G) Filaments bound to small vesicles from BamA minicells. Scale bars 100 nm for minicell views and 50 nm for close-up views.

