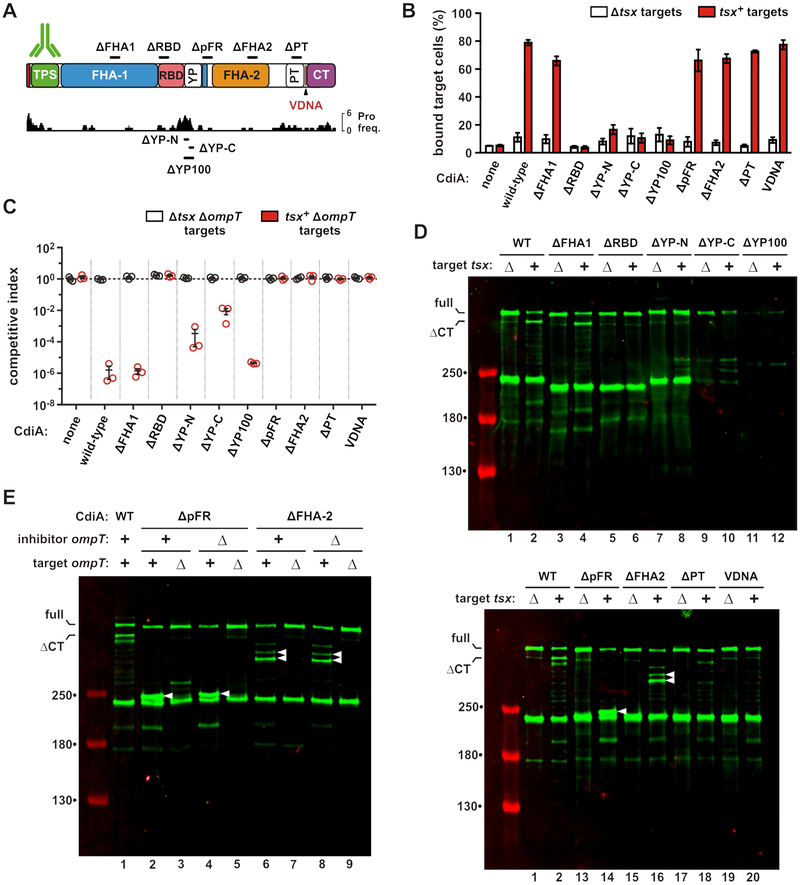
Figure 5. The YP domain is required for cell-surface presentation.
A) CdiASTECO31 deletion constructs. See Figures S2. B) Target cell adhesion. GFP-labeled inhibitors were mixed with DsRed-labeled targets, and analyzed by flow cytometry to quantify the fraction of target cells bound to inhibitors. Data are presented as mean ± SEM. C) Competition co-cultures. Inhibitors were mixed at a 1:1 ratio with targets and co-cultured on LB-agar. Competitive indices equal the final ratio of targets to inhibitors divided by the initial ratio. Data are presented as mean ± SEM. D) Inhibitors were mixed with targets and CdiA analyzed by anti-TPS immunoblotting. E) ΔpFR and ΔFHA-2 inhibitors were mixed with target cells, and CdiA analyzed by anti-TPS immunoblotting. Inhibitor and target cells carried ΔompT mutations where indicated. White carets indicate aberrantly processed CdiA. See Figure S5.

