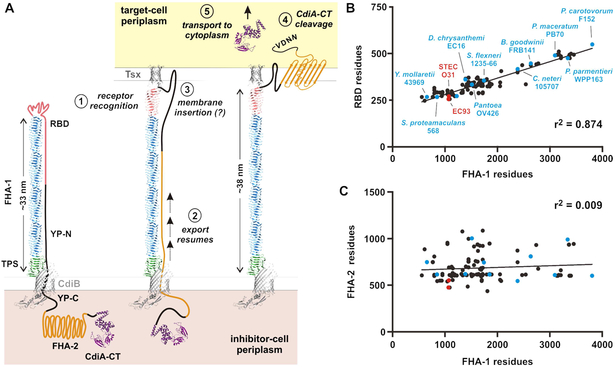
Figure 7. Model for CdiA surface topology and receptor-triggered toxin delivery.
A) Model of CdiA surface topology. Receptor recognition (1) triggers export of the C-terminal half of CdiA (2). The FHA-2 domain interacts with the target-cell outer membrane (3), perhaps forming a β-barrel translocon. Once transferred into the target-cell periplasm, the CdiA-CT region is cleaved (4) for transport into the cytoplasm (5). B) RBD size is proportional to filament length. RBD residues are plotted as a function of FHA-1 residues. See Figure S3 & Table S2. C) Plot of FHA-2 versus FHA-1 residues for the effectors in panel B. See Table S2.

