
Figure 3.
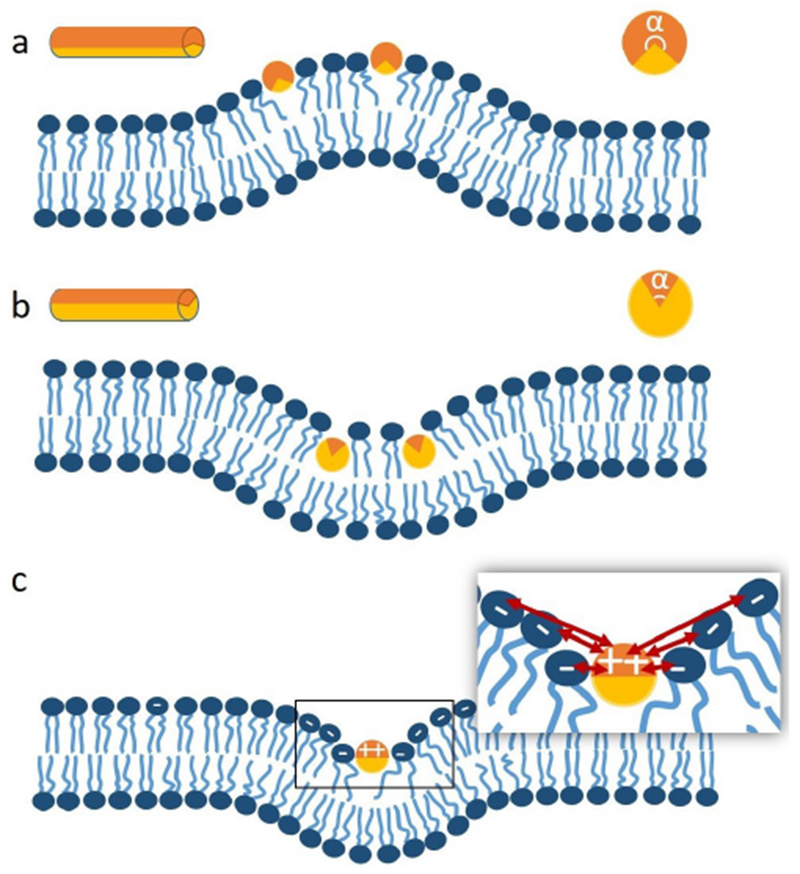
Mechanistic models of AH-induced membrane curvature. (a) Helix insertion/wedging induces positive membrane curvature and the hydrophobicity distribution on the helix. Orange color indicates the hydrophilic region (spanning polar angle α) while yellow denotes the hydrophobic region. (b) Deeper insertion of AHs induces negative curvature. (c) Negative curvature induced by electrostatic wrapping. The red arrows represent electrostatic interactions.