
Figure 5.
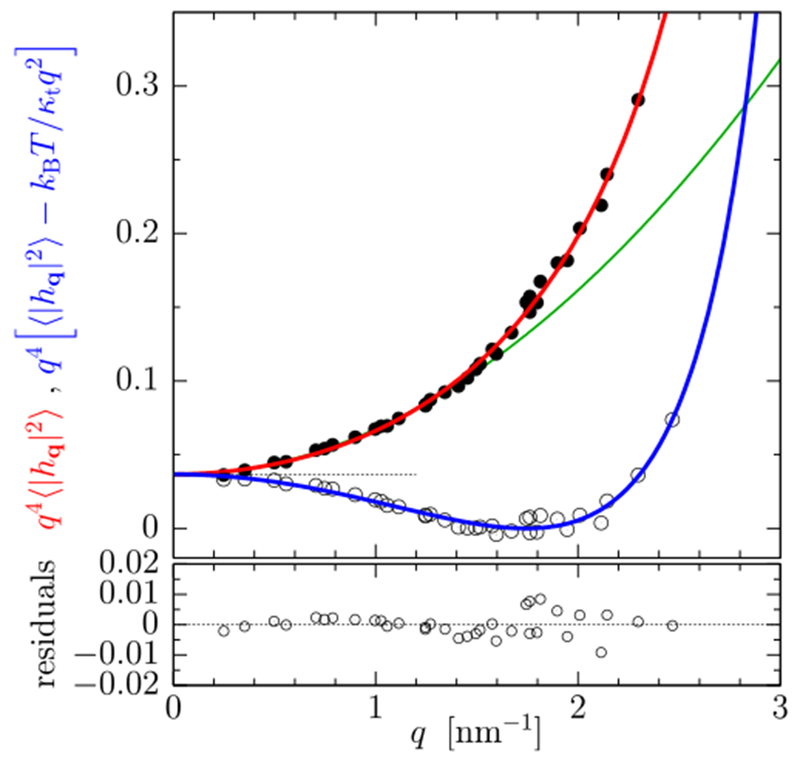
Power spectrum of membrane undulations for the CG MARTINI model of DPPC at 50 °C. Reprinted with permission from [34]. Copyright 2017, AIP Publishing LLC. The red and blue curves are fits to a revised theory including a new tilt-curvature coupling term from which can be extracted; the green curve is a fit using the original theory [29] (using wave vectors up to q = 1.5 nm−1).