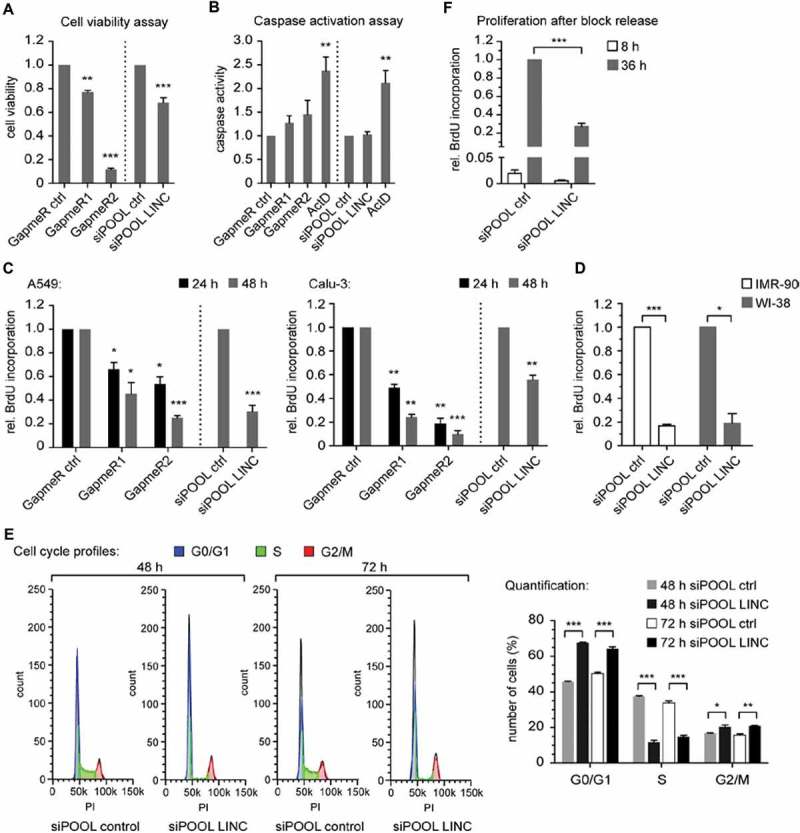
Figure 3.

LINC00673 reduces cell proliferation and induces a cell cycle arrest. (A) CellTiter-Glo Luminescent Cell Viability Assay (Promega) was performed 48 h after LINC00673 knockdown in A549 cells with GapmeRs (60 nM; n = 3) and siPOOLs (10 nM; n = 4), respectively. (B) Caspase-Glo 3/7 luminescent assay (Promega) was performed 24 h after LINC00673 knockdown in A549 cells (final concentration of GapmeRs and siPOOLs as in A; n = 6 for GapmeR-mediated knockdown and n = 4 for siPOOL-mediated knockdown experiments). Treatment with actinomycin D (ActD; 5 µg/ml) served as a positive control for apoptosis induction. (C) BrdU Cell Proliferation ELISA Kit (Roche) was used to quantify cell proliferation 24 h and 48 h after LINC00673 knockdown (final concentrations as in A; n = 3 for GapmeR-mediated knockdown in A549 and Calu-3; n = 5 for siPOOL-mediated knockdown in A549 and n = 3 for Calu-3). (D) BrdU Cell Proliferation ELISA Kit was used to quantify cell proliferation 48 h after siPOOL-mediated knockdown (final concentration of 1 nM) of LINC00673 in IMR-90 and WI-38 cells (n = 3). (E) Cell cycle profiles of A549 cells were analyzed by FACS after 48 h and 72 h of LINC00673 knockdown. Quantification of cells with the cell cycle function of FlowJo (V10) and the cell cycle profiles of one representative experiment are shown (n = 3). (F) IMR-90 cells were serum starved for 24 h and subsequently transfected with 0.3 nM siPOOLs. Cells were released by adding complete medium supplemented with 10% FBS at 72 h after knockdown and BrdU incorporation was measured 8 h and 36 h following block release (n = 4). In A-F the mean + SEM is shown and the statistical significance was determined per two-sided unpaired Student t test, with *, P < 0.05; **, P < 0.01; ***, P < 0.001.
