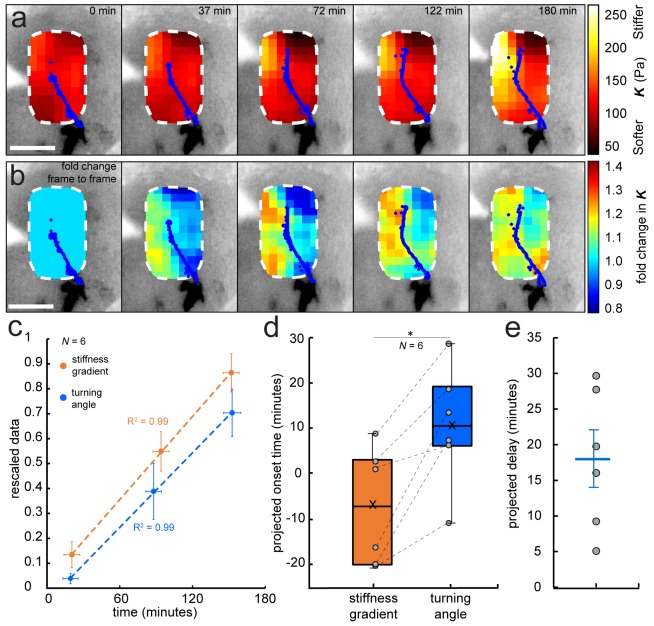
Figure 2. Development of a stiffness gradient in the Xenopus embryo brain precedes axon turning.
(a) Time-lapse stiffness maps obtained from a tiv-AFM experiment, showing outlines of fluorescently labelled OT axons (blue) and processed AFM-based stiffness maps (colour maps) overlaid on images of the brain. Colour maps encode the apparent elastic modulus K, a measure of tissue stiffness, assessed at an indentation force F = 10 nN. The time in minutes on each frame is taken from the timestamp of the first measurement in each successive stiffness map; the corresponding overlaid fluorescence images were obtained simultaneously. (b) Visualisation of fold-changes in brain tissue stiffness from one time point to the next, based on the interpolated and smoothed data shown in Figure 2a. Colour scale encodes the fold-change in K at each location on the stiffness map, expressed relative to the values at the previous time point, with the exception of t = 0 min, where all values were set to 1.Tissue stiffness changes throughout the time course, with large changes already occurring between ~40–80 min after the start of the experiment. (c) Plot of mean re-scaled values for the stiffness gradient (orange) and OT turn angle (blue). Stiffness values were binned to match the time points of the developmental stages at which cell body densities were assessed. Dashed lines denote linear fits (R2 = 0.99). (d) Boxplots of the extrapolated appearance times of the stiffness gradients and the onset of OT axon turning, relative to the start time of tiv-AFM measurements, with ladder plots for individual embryos overlaid (grey circles/dashed lines). Extrapolations are based on linear fits to the re-scaled data for individual animals (Figure 2c). Stiffness gradients appear significantly earlier than the onset of axon turning (p=0.03, paired Wilcoxon signed-rank test). (e) Scatterplot showing the time delay between extrapolated onsets of stiffness gradients and axon turning, calculated for individual animals. The average delay of 18 min is indicated by the blue line. Boxplots show median, first, and third quartiles; whiskers show the spread of the data; ‘×’ indicates the mean. Error bars denote standard error of the mean. *p<0.05. AFM measurement resolution, 20 µm; all scale bars, 100 µm. N denotes number of animals.


