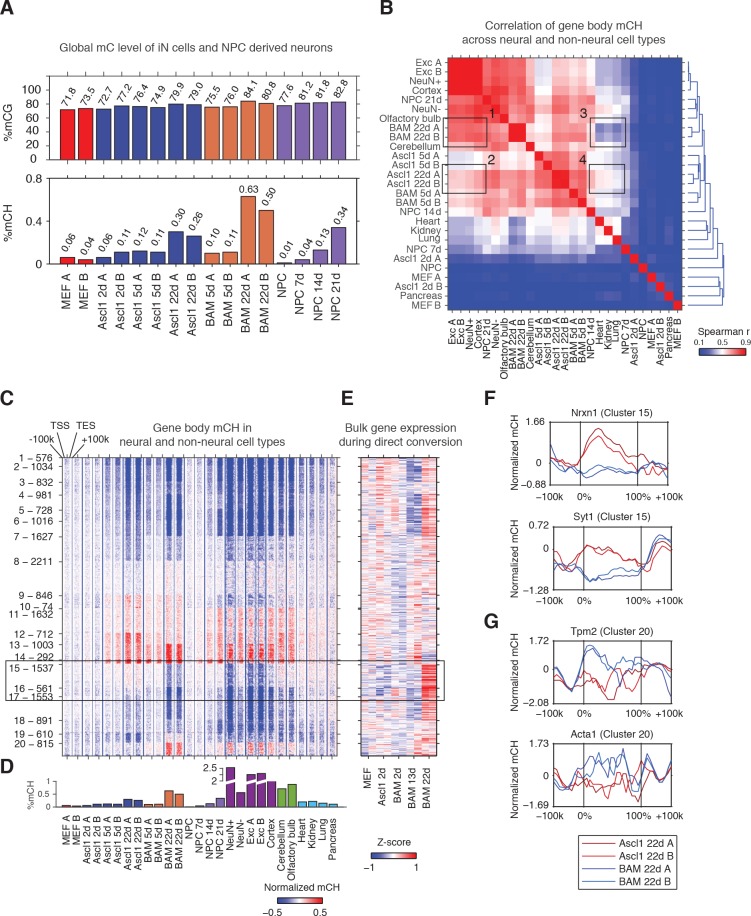
Figure 1. The Ascl1, Brn2 and Myt1l reprogramming factors induce an authentic, neuron-specific CH methylation pattern in fibroblasts.
(A) Global mCG (top panel) and mCH (bottom panel) levels of iN cells and NPC-derived cells. mCG and mCH accumulates in both maturing iN cells and differentiating NPCs. (B) Correlation of gene body mCH levels of iN cell reprogramming samples, NPC derived cells, neural and non-neural tissues. Mature cortical neurons clustered more closely to BAM 22d than Ascl1 22d iN cells. NeuN +and NeuN- indicate neuronal and glial nuclei separated using anti-NeuN antibody, respectively (Lister et al., 2013). Exc indicates purified nuclei from excitatory neuron expressing Camk2a+ (Mo et al., 2015). (C) Left panel - K-means clustering of gene body mCH normalized to flanking regions (100 kb surrounding the gene). Reprogramming with BAM produces a global mCH profile more similar to cortical neurons compared to Ascl1 alone. TSS - Transcription Start Site. TES - Transcription End Site. (D) Global mCH level of samples compared in (C). (E) Relative expression (Z-score) of bulk RNA-seq analysis of iN cell reprogramming. Gene expression is inversely correlated to gene body mCH. (F–G) mCH pattern at genes with neuronal (F) and myogenic functions (G) in Ascl1 22d and BAM 22d iN cells. BAM 22d cells show greater depletion of mCH at synaptic genes and accumulation of mCH at myogenic genes, suggesting more efficient activation of neuronal genes and suppression of the alternate myogenic program compare to Ascl1 22d.


