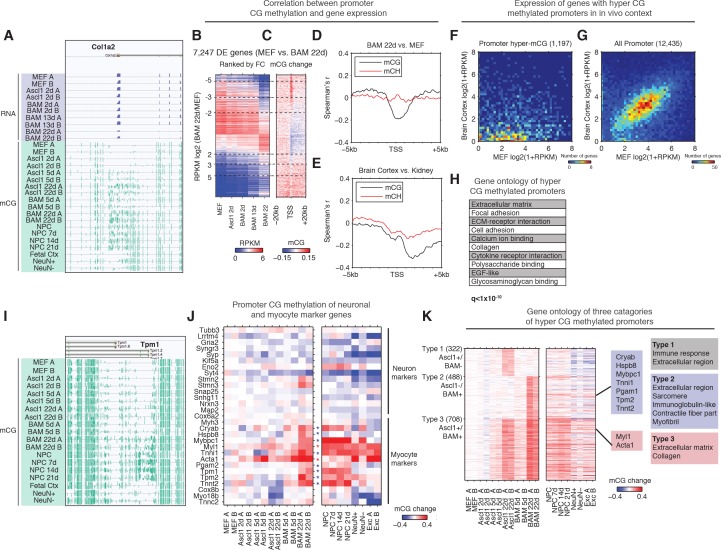
Figure 3. Silencing of key non-neuronal programs is associated with promoter hyper CG methylation.
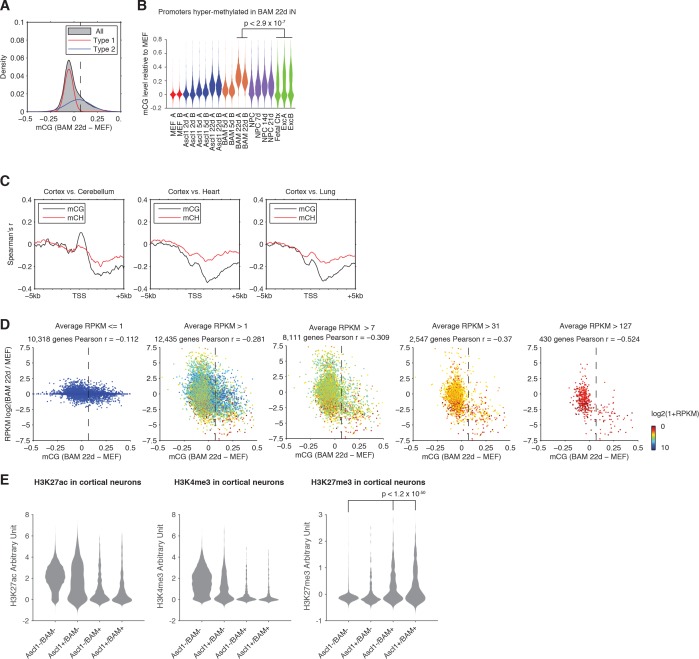
(A) Browser view of fibroblast marker gene Col1a2 promoter methylation dynamics and corresponding gene expression during reprogramming. The promoter is strongly methylated throughout NPC differentiation, but is unmethylated in fetal cortex, cortical neurons and glia. However, it gradually accumulates mCG through the course of reprogramming using either Ascl1 alone or BAM factors. (B) Differentially expressed genes between BAM 22d iN and MEF were ranked by their relative fold-changes. (C) mCG change between MEF and BAM 22d in ±20 kb regions surrounding TSS of differentially expressed genes. Hyper CG methylation was found at TSS for downregulated genes. (D) Correlation between mCG change and differential gene expression between BAM 22d iN and MEF in ±5 kb region surrounding TSS. (E) Correlation between mCG change and differential gene expression between brain cortex and kidney in ±5 kb regions surrounding TSS. (F–G) Scatter plots comparing the expression of genes with hyper CG methylation promoter in BAM 22d iN cells (F) or all genes (G) between MEF and brain cortex. Hyper CG methylation genes in BAM 22d cells are strongly repressed compared to all genes in the in vivo context. (H) Gene ontology term enrichment of genes with hyper CG methylation promoters in BAM 22d iN cells. (I) Browser view of promoter mCG dynamics of myocyte marker gene Tpm1. The promoter is methylated through NPC differentiation, but is unmethylated in fetal cortex and cortical neurons and glia. However, it remains unmethylated when reprogramming with Ascl1 alone, and only accumulates mCG in the presence of Brn2 and Myt1l in BAM. (J) Promoter mCG dynamics of neuron and myocyte marker genes during reprogramming. Blue asterisks indicate promoters hyper-methylated in BAM 22d iN, but not in Ascl1 22d iN. Red asterisks indicate promoters hyper-methylated in both BAM 22d iN and Ascl1 22d iN. A majority of myocyte genes are only hyper methylated by BAM and not Ascl1 alone. (K) Left: Heatmaps showing promoter mCG during neuronal reprogramming, NPC differentiation and in primary neurons. Promoters were categorized into three groups showing hyper-mCG (mCG increase >0.1) in Ascl1 22d only, BAM 22d only or both type of iN cells. Right: Gene ontology enrichment of promoters for the three groups. Promoters of fibroblast genes were hyper CG methylated in both Ascl1 alone and BAM iN cells, but only BAM 22d cells exhibit strong hyper CG methylation at myogenic genes.


