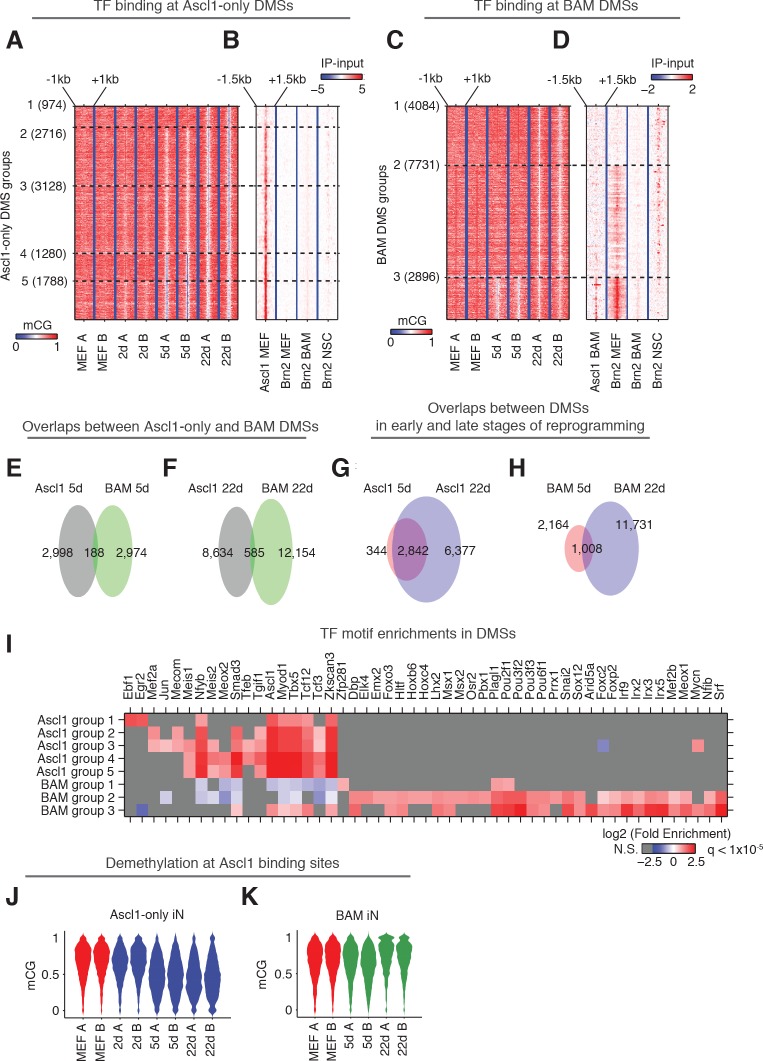
Figure 4. Ascl1 and BAM factors induce distinct CG methylation reconfigurations.
(A and C), DMSs identified and combined from all pairwise comparisons during reprogramming driven by Ascl1 alone (A) or BAM (C) were ordered by the kinetics of mCG remodeling (see Materials and methods). The plots show clusters containing more than 100 DMSs, which are statistically more robust. (B and D) Signal intensity of Ascl1 and Brn2 ChIP-seq were plotted for 3 kb regions surrounding the DMSs. (E–H) The overlaps of DMSs identified at different stages of reprogramming driven by Ascl1 or BAM expression. (I) TF binding motif enrichment in DMS groups shown in (A) and (C). Insignificant enrichments (q > 1×10⁻⁵) were shown as gray. (J) The distribution of mCG level at Ascl1 peaks during Ascl1-only induced cells during reprogramming. (K) The distribution of mCG level at Ascl1 peaks in BAM induced cells during reprogramming.


