. 2019 Jan 15;8:e40197. doi: 10.7554/eLife.40197

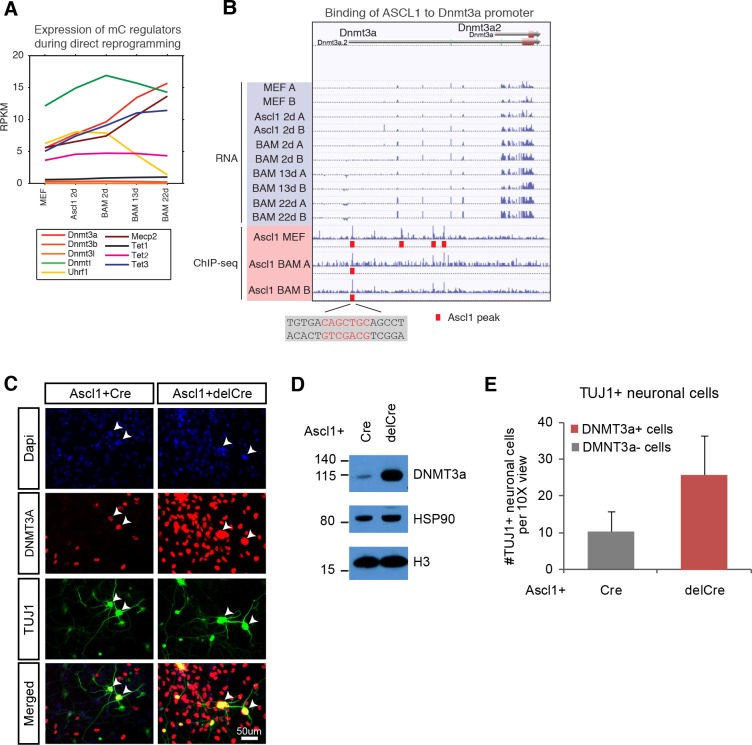
Figure 5. de novo DNA methylation is required for efficient reprogramming from fibroblasts to neurons.

(A) Expression of DNA methylation regulators and readers during neuronal reprogramming. (B) Ascl1 ChIP-seq peak is located proximal to Dnmt3a promoter. (C) Immunostaining of Dnmt3a/3bfl/fl cells 14d post-Ascl1 induction with dox. There appears to be a similar reprogramming efficiency when comparing the CreGfp (left) and delCreGfp (right) conditions. However, most TUJ1 +iN cells in the CreGfp condition were still expressing low levels of DNMT3A (white arrows) despite co-infection with CreGfp. (D) Western blot showing efficient knock-out of DNMT3A in Ascl1 +Cre expressing cells compared to Ascl1 +delCre control 13 days post induction of Ascl1. (E) Average counts of TUJ1 +iN cells per 10X field of view 14d post-Ascl1 induction that are co-infected with 1) CreGfp and Dnmt3a- (gray) or 2) delCreGfp and Dnmt3a+ (red) (error bars are stderr, n = 3).

Figure 5.

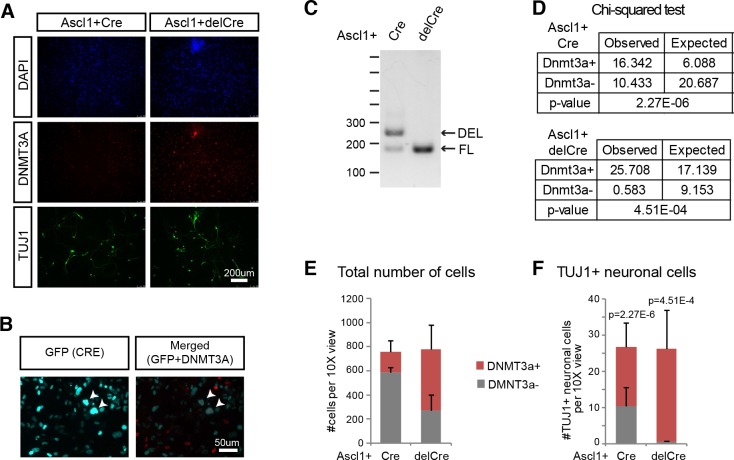
Figure 5—figure supplement 1. Deletion of Dnmt3a/3b in fibroblasts leads to reduced reprogramming efficiency. .

Figure 5—figure supplement 1.

(A) 10X view of immunostaining in Ascl1 +CreGfp/delCreGfp samples. (B) Corresponding GFP staining (for CREGFP fusion protein) for Figure 5C. Even though iN cells are expressing high levels of CRE, which should loop out the Dnmt3a locus, cells are still expressing DNMT3A protein. (C) Genotyping of Dnmt3a/b fl/fl cells. Floxed mutant bands (FL) appear at ~200 bp while deleted bands (DEL) appear at ~250 bp. (D) Chi-squared test for significance for Figure 5—figure supplement 1E–F. The null hypothesis is that if Dnmt3a- cells reprogram as well as the Dnmt3a + cells, there should be no significant difference in the frequency of Dnmt3a- cells and the frequency of cells that actually reprogram into neurons. There is a significant difference for both Cre (p=2.27E-6) and delCre (p=4.51E-4) conditions, indicating that Dnmt3a- cells are less efficient in reprogramming into iN cells. (E and F) Average counts of DAPI +cells (E) or TUJ1 +iN cells (F) 14d post-Ascl1 induction that are either DNMT3A positive (red) or negative (gray) per 10X field of view. Using a Chi-squared test (Figure 5D; Figure 5—figure supplement 1D), there is a significant difference between the frequencies of total number DNMT3A- cells compared to the number of DNMT3A- iN cells in both Cre and delCre conditions.