
Figure 5. Electrical synapses between Shox2 INs act as low-pass filters.
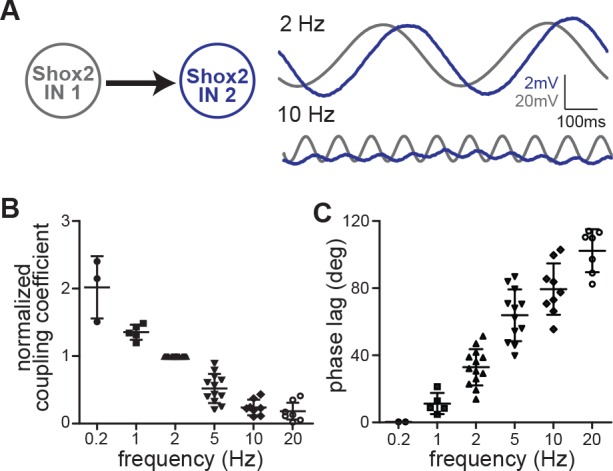
(A) Membrane oscillations in Shox2 IN 1 (gray) and Shox2 IN 2 (blue) resulting from subthreshold sinusoidal current injections (±20 pA) to Shox2 IN 1 at 2 Hz and 10 Hz frequencies. All traces are averages of 10 sweeps. (B) Coupling coefficients normalized to value at 2 Hz to demonstrate frequency-dependence. Coupling strength decreased with increasing frequency of injected current (0.2 Hz; n = 3; 1 Hz, n = 5; 2 Hz, n = 13; 5 Hz, n = 12; 10 Hz, n = 8; and 20 Hz, n = 7) Error bars represent SD. (C) Phase lag is frequency dependent. As the frequency of the injected current increased, phase lag increased (0.2 Hz, n = 2; 1 Hz, n = 5; 2 Hz, n = 13; 5 Hz, n = 12; 10 Hz, n = 9; and 20 Hz, n = 7).
Figure 5—source data 1. Coupling coefficient source data for Figure 5B.
elife-42519-fig5-data1.xlsx (12.6KB, xlsx)
DOI: 10.7554/eLife.42519.013
Figure 5—source data 2. Phase lag source data for Figure 5C.
elife-42519-fig5-data2.xlsx (8.8KB, xlsx)
DOI: 10.7554/eLife.42519.014