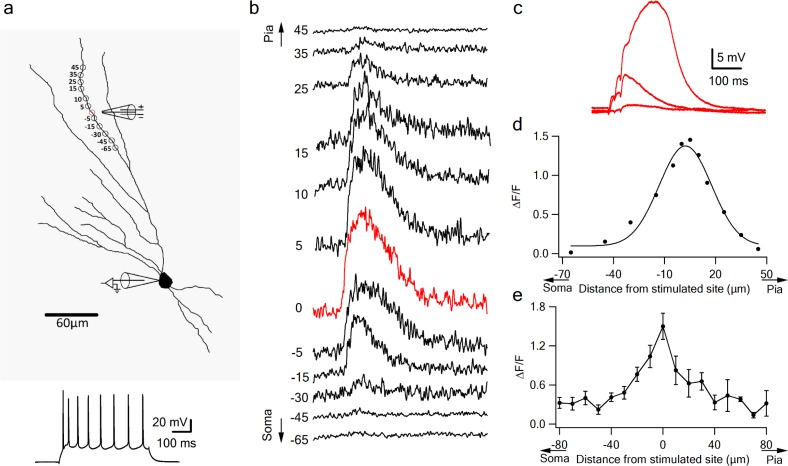
Figure 3. Local calcium transients evoked by dendritic NMDA spikes.
(a) Fluorescence reconstruction of a layer IIB pyramidal neuron, showing stimulation electrode (288 µm from soma) and the sites of calcium imaging (red circle denotes the location of synaptic stimulation). Bellow, is somatic action potential firing patter in response to somatic step current injection (500 ms). (b) Calcium profile along the stimulated apical dendrite. Calcium transients are expressed as ∆F/F shown for different segments around the stimulated site (as illustrated in A). ‘0’ denotes stimulation location, while distances (in µm) from stimulation site towards pia is indicated as +ve and towards soma as –ve. (c) Example of subthreshold EPSPs and an NMDA spike evoked at this recording site. d. Calcium profile (peak ∆F/F) fitted by a Gaussian curve plotted as a function of distance of spike location (for the experiment shown in a-b). (e) Summary plot of mean change in calcium transient (∆F/F ± SEM) evoked by an NMDA spike, as a function of the distance from the center of a stimulated segment (0) averaged in 10 µm segments, from proximal (-ve values) to distal (+ve locations). All cells contained OGB-6F dye, perfused through the patch pipette (n = 5).

