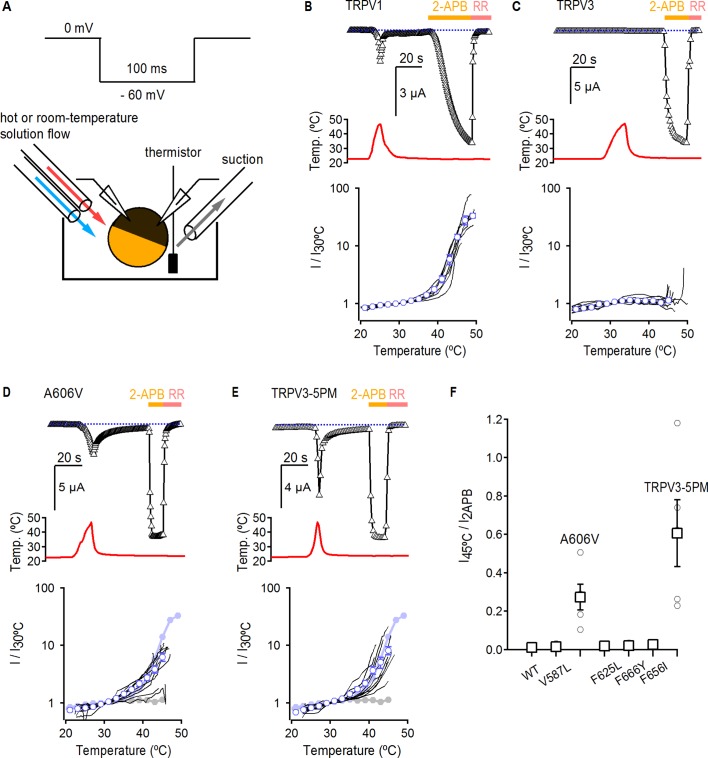
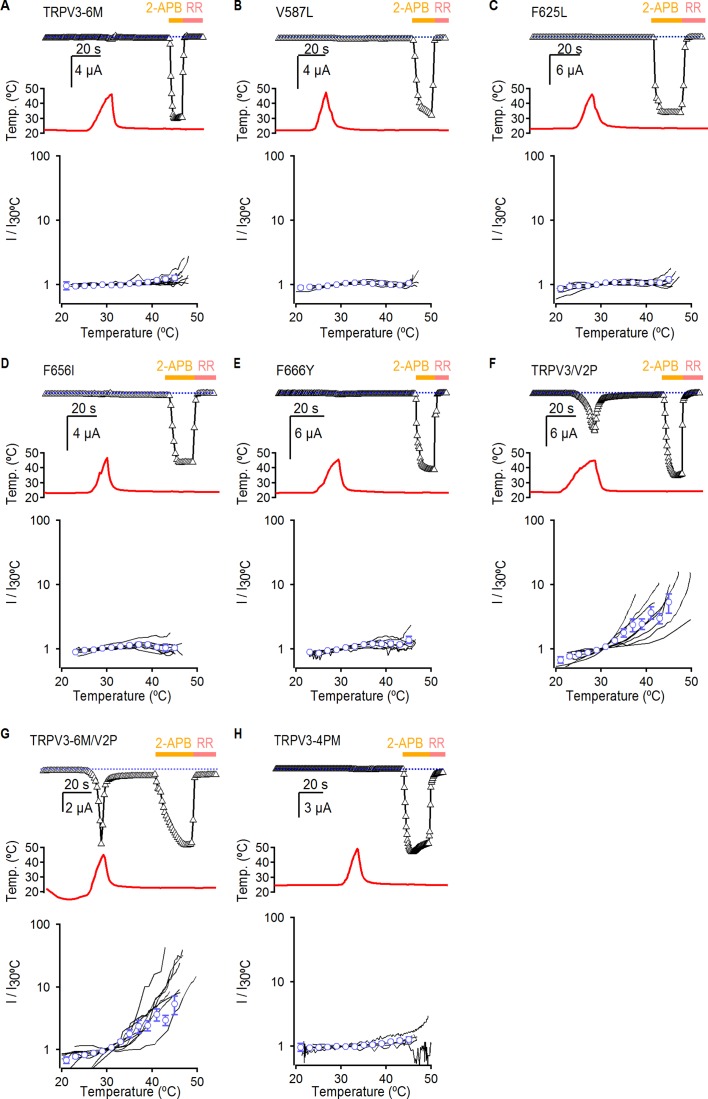
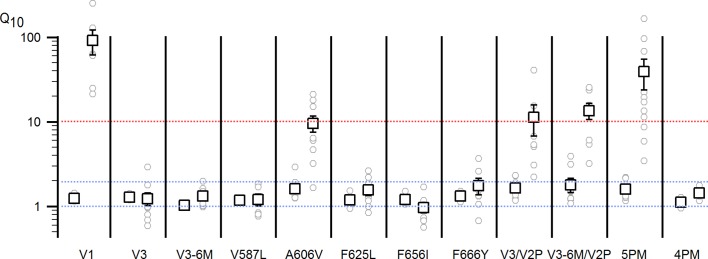
Figure 3. Temperature sensitivity of TRPV3 constructs.
(A) Voltage protocol used for recording the temperature responses (top), and a cartoon of the temperature-control system used for the experiments (bottom). Temperature was controlled by using two perfusion lines immersed in baths at high- or room-temperature (Zhang et al., 2018), and temperature was measured with a thermistor positioned close to the oocyte. (B) Representative time-course obtained from a TRPV1-expressing oocyte (upper panel), showing the response to a heating stimulus, followed by the application of 3 mM 2-APB and RR (50 µM). The dotted line indicates the zero-current level. The recorded temperature is shown in the middle panel. The bottom panel shows the currents in a log-scale at −60 mV normalized to their value at 30°C plotted as a function of temperature, obtained from experiments as in the upper panel. Data from individual cells are shown as black curves, and the mean ± S.E.M as blue open circles (n = 7). (C–E) Representative current- (top panel) and temperature- (middle panel) time courses obtained from the constructs indicated. The lower panel shows the I-temperature relations in a log-scale obtained from experiments as in the upper panel (n = 5–11). In (D) and (E), the curves in solid circles correspond to the mean I vs T relations for WT TRPV1 (light blue) and TRPV3 (grey). (F) Summary of current responses to heat (45°C) relative to saturating 2-APB (3 mM) at room temperature. Values for individual oocytes are shown as open circles and mean ±S.E.M. as open squares (n = 4–5).


