. 2019 Jan 15;8:e39856. doi: 10.7554/eLife.39856

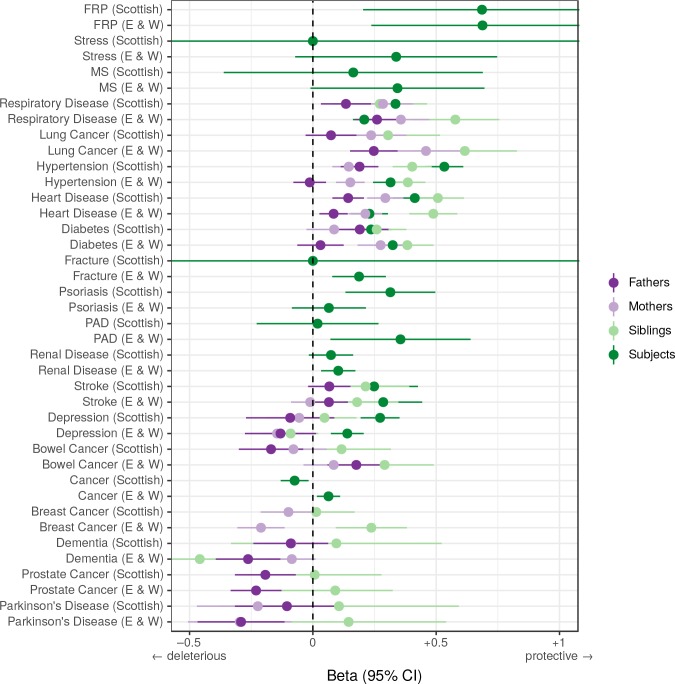
Figure 10. Associations between polygenic lifespan score and diseases of UK Biobank subjects and their kin.

Logistic regression was performed on standardised polygenic survival score (all variants) and 21 disease traits reported by 24,059 Scottish and 29,815 English/Welsh out-of-sample individuals about themselves and their kin. For grouping of UK Biobank disease codes, see Figure 10—source data 1. Displayed here are inverse-variance meta-analysed estimates of the diseases for which multiple sources of data were available (i.e. parents and/or siblings; see Figure 10—figure supplement 1 for all associations). ‘Cancer’ is only in subjects, whilst the specific subtypes are analysed for kin. The left panel shows disease estimates for each kin separately; the right panel shows the combined estimate, with standard errors adjusted for correlation between family members. Diseases have been ordered by magnitude of effect size (combined estimate). Beta – log odds reduction ratio of disease per standard deviation of polygenic survival score, where a negative beta indicates a deleterious effect of score on disease prevalence (lifetime so far), and positive beta indicates a protective effect on disease. Effect sizes for first degree relatives have been doubled. Cancer – Binary cancer phenotype (any cancer, yes/no).

Figure 10—source data 1. Grouping of UK Biobank disease codes into diseases and major disease categories.
UKBB phenotypes included 29 self-reported non-cancer disease fields for the participants and each of their parents, which included 474 integer-value coded diseases. These 474 diseases were aggregated and meta-analysed into four major mortality-increasing disease groups, namely CVD, diabetes, neurological and pulmonary disorders. Cancer was the fifth major disease group and was coded as either the occurrence or absence of cancers instances throughout the participant’s lifetime. Codes not shown were excluded from the analysis.
DOI: 10.7554/eLife.39856.032
Figure 10—source data 2. Associations of polygenic score with diseases in UK Biobank.
A polygenic risk score was made for each subject using GWAS results that did not include the subject sets under consideration. Disease associations have been identified in the subjects, their siblings, or parents, at FDR 5%. See Figure 10—source data 1 for disease code grouping. Sample –– Out-of-sample subsets of UK Biobank individuals used for PGRS association (E and W: English and Welsh). Kin – Family member for which the disease was reported. Trait – Disease reported by UK Biobank subject. N – Number of individuals tested. Cases – Number of reported individuals or kin carrying the disease. Beta – log OR of NOT carrying the disease per standard deviation of PGRS (i.e. positive beta indicates the PGRS protects from disease). SE – Standard Error. P – Two-sided P value. Q – Benjamin-Hochberg adjusted P value.
DOI: 10.7554/eLife.39856.033

Figure 10.

Figure 10—figure supplement 1. Associations between polygenic survival score and diseases of individuals and their kin from Scottish and English/Welsh subsamples of UK Biobank.

Figure 10—figure supplement 1.

Logistic regression was performed on standardised polygenic survival score (all variants) and 21 traits reported by 24,059 Scottish and 29,815 English/Welsh out-of-sample individuals about themselves and their kin. Diseases have been ordered by magnitude of effect size (meta-analysed between cohorts and kin). Beta – log odds reduction ratio of disease per standard deviation of polygenic survival score, where a negative beta indicates a deleterious effect of score on disease prevalence (lifetime so far), and positive beta indicates a protective effect on disease. Effect sizes for first degree relative have been doubled. Cancer – Binary cancer phenotype (yes/no), FRP – Female Reproductive Problems, MS – Multiple Sclerosis, PAD – Peripheral Artery Disease.