. 2019 Jan 15;8:e39856. doi: 10.7554/eLife.39856

Figure 5. Age and sex specific effects on parent survival for 5 variants showing 5% FDR age- or sex-specificity of effect size from 23 lifespan-increasing variants.

Figure 5.

(A) Variants showing age-specific effects; (B) Variants showing sex-specific effects. Panel titles show the gene, cluster of genes, or cytogenetic band in close proximity to the index lifespan variant, with this variant and lifespan-increasing allele in parentheses. Beta – loge(protection ratio) for 1 copy of effect allele in self in the age band (i.e. 2 x observed due to 50% kinship). Note the varying scale of y-axis across panels. Age range: the range of ages over which beta was estimated. Sex p – nominal P value for association of effect size with sex. Age p – nominal P value for association of effect size with age.

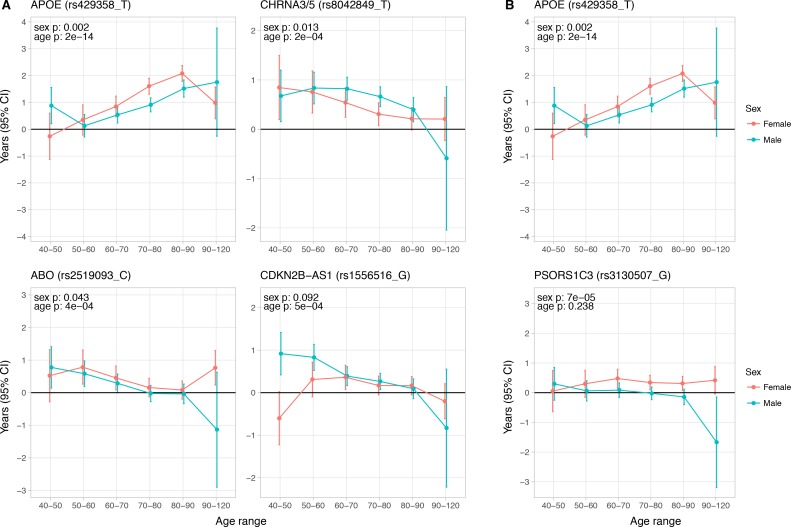
Figure 5—source data 1. Sex and age stratified effects on survival for 24 lifespan increasing variants.
At or near – Gene, cluster of genes, or cytogenetic band in close proximity to lead variant. Variant – rsID, longevity allele. Parent – Parent. Age range – Lower limit to upper limit of age in analysis. N – Number of lives used for the analysis (e.g. a parent aged 55 contributed to analysis of 40–50 and 50–60, but not 60–70). Deaths – Number of deaths within the age range. Beta – loge(protection ratio) for 1 copy of effect allele in self in the age band (i.e. 2 x observed due to kin cohort method). SE – Standard error. Z – Test statistic for test of H0. P – P value of two sided test of association.
DOI: 10.7554/eLife.39856.019
Figure 5—source data 2. Effect sizes of sex and age moderators within fixed-effects with moderators’ model of longevity alleles for 24 SNPs.
At or near – Gene, cluster of genes, or cytogenetic band in close proximity to lead variant. Variant – rsID, longevity allele. Beta – Moderator effect estimate of sex (categorical variable, being male) or age (ordinal variable, mean age in age band) on lead SNP effect on lifespan. SE – Standard error. P – P value for association of SNP lifespan effect size with age or sex. Q – Benjamini-Hochberg FDR-corrected P value. Bolded lines contain sex or age-specific effects passing a 5% FDR threshold.
DOI: 10.7554/eLife.39856.020