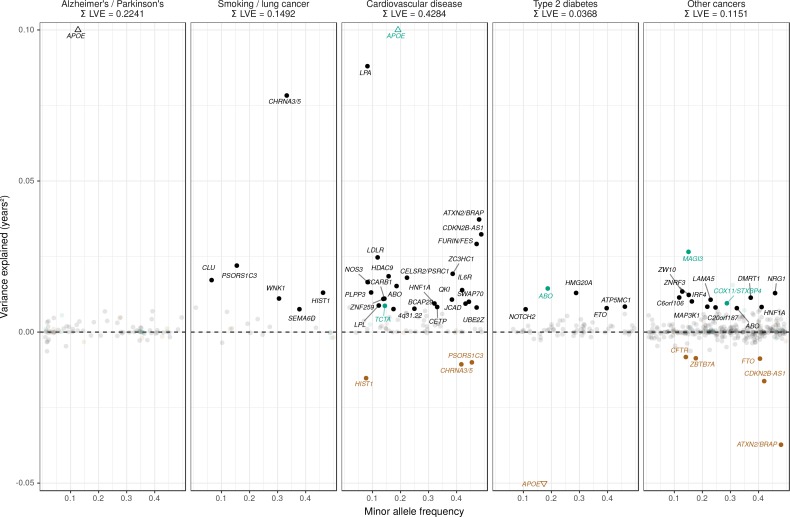
Genome-wide significant disease SNPs from the GWAS catalog are listed with the amount of lifespan variance explained (LVE), with disease-protective alleles signed positively when increasing lifespan and signed negatively when decreasing lifespan. SNPs with limited evidence of an effect on lifespan are greyed out: an FDR cut-off of 1.55% is applied simultaneously across all diseases, allowing for one false positive among all significant SNPs. Secondary pleiotropic SNPs (i.e. those associating strongly with another one of the diseases, as assessed by PheWAS in UK Biobank) are coloured, as less relevant to the disease in question. Of these, turquoise SNPs show one or more alternative disease associations in the same direction and at least twice as strong (double Z statistic) as the principal disease, while brown SNPs show one or more significant associations with alternative disease in the opposite direction that explains the negative association of the disease-protective SNP with lifespan. Of specific interest is the SNP near MAGI3, which is reported as a breast cancer SNP but associates more strongly with CVD in UK Biobank and shows no evidence of sex-specific effects on lifespan. However, we do not classify it as a CVD SNP as its main effect on lifespan is likely due to protection from autoimmune disease by a nearby missense variant (rs6679677_C, r
2 > 0.6, 95% CI log OR type one diabetes –0.74 to –0.46 (
Cooper et al., 2008); rheumatoid arthritis −0.66 to −0.50 (
Raychaudhuri et al., 2008), and carrying these diseases can reduce life expectancy up to 13 years (
Myllykangas-Luosujärvi et al., 1995;
Livingstone et al., 2015). Similarly, the HLA-DQA1 locus also associates most strongly with autoimmune disease and is therefore absent from the analysis. At or near – Gene, cluster of genes, or cytogenetic band in close proximity to lead variant. Chr – Chromosome. Position – Base-pair position on chromosome (build GRCh37). A1 – Allele protecting from disease or disease risk factors. Freq1 – Frequency of the disease-protective allele in the discovery + replication sample. Years – Years of lifespan gained for carrying one copy of the A1 allele. P – P value for association with lifespan under CES assumption (left), P value for genome-wide significant association with disease as reported in the GWAS catalog (right). Q – Benjamini-Hochberg FDR-corrected P value for association with lifespan. LVE – Lifespan variance explained, signed positively when A1 increases lifespan and negative when A1 decreases lifespan. Pleiotropic – SNP shows evidence of pleiotropy, see definition above. Trait – Disease trait reported in GWAS catalog. Beta1 – log OR for having the reported disease, or unit increase in risk factors associated with disease, per copy of A1 allele. PMID – PubMed identification number of the study reporting the disease association. Z estimates – Z statistic for association with disease in unrelated, Gen. British UK Biobank samples. Missing statistics indicate the SNP is not present in the CES meta-analysis summary statistics and its LVE has been imputed from the closest proxy (min. r
2 > 0.9) or proxies if equally close.

