. 2019 Jan 15;8:e39856. doi: 10.7554/eLife.39856

Figure 8. Survival curves for highest and lowest deciles of lifespan polygenic risk score.

A polygenic risk score was made for each subject using GWAS results that did not include the subject sets under consideration. Subject or parent survival information (age entry, age exit, age of death (if applicable) was used to create Kaplan-Meier curves for the top and bottom deciles of score. In this figure (only) no adjustment has been made for the dilution of observed effects due to parent imputation from cohort subjects. Effect sizes in parent, if parent genotypes had been used, are expected to be twice that shown. E and W – England and Wales; PRS – polygenic risk score.

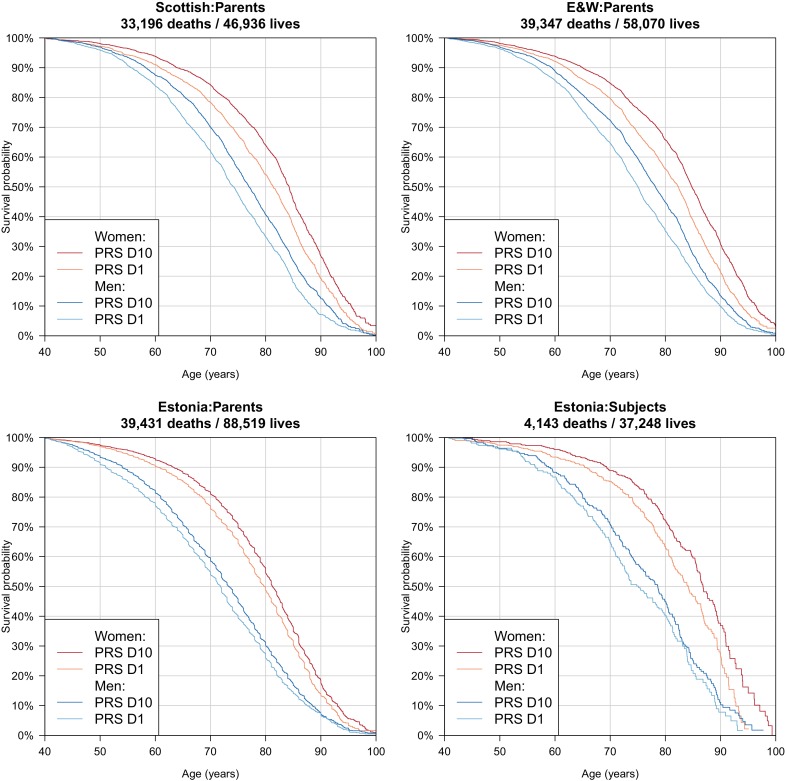
Figure 8.

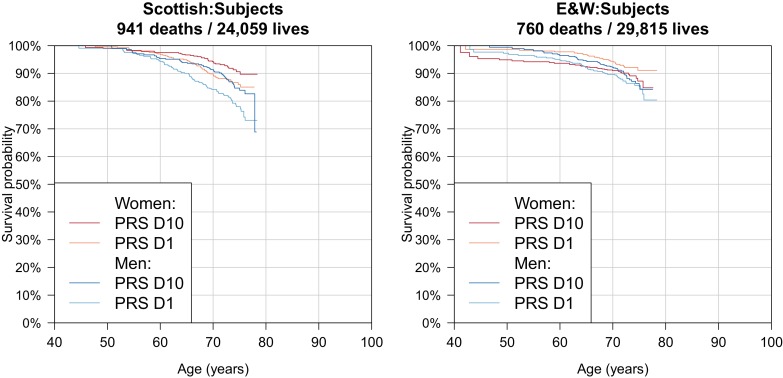
Figure 8—figure supplement 1. Survival Curves for highest and lowest deciles of lifespan polygenic risk score in UK Biobank subjects.

Figure 8—figure supplement 1.

A polygenic risk score was made for each subject using GWAS results that did not include the subject sets under consideration. Subject survival information (age entry, age exit, age of death (if applicable) was used to create Kaplan-Meier curves for the top and bottom deciles of score. The narrow range of ages and short time since inception means that UK Biobank subject curves are subject to greater uncertainty, particularly at each end, and only cover a shorter interval. E and W – England and Wales; PRS – polygenic risk score.