. 2018 Dec 18;7:e37412. doi: 10.7554/eLife.37412

Figure 1. Distribution of an intact open reading frame (ORF), mRNA transcript, and protein for the OPN1SW, OPN1LW, and RHO photopigments in ecologically diverse noctilionoid bats.

The composition of species diet follows Rojas et al. (2018), dietary types are indicated with the following symbols: invertebrates – moth, vertebrates – frog, fruit – fruit and nectar/pollen – flower. The species phylogeny follows Rojas et al. (2016) and Shi and Rabosky (2015). Vertical black bars, from left to right, indicate: (1) Noctilionoidea, (2) Phyllostomidae, (3) and Stenodermatinae. RNA-Seq data was generated to both infer the presence of an intact ORF (in combination with genomic and PCR sequence data) and to determine the presence of an expressed mRNA transcript. The presence of an intact ORF and mRNA transcript for RHO was verified across all transcriptomes. The presence/absence of a protein product for S- and L-opsins was assayed by IHC on flat mounted retinas. The presence of an intact ORF, mRNA, and protein are indicated by a filled color marker (OPN1SW – purple, OPN1LW – green and RHO – blue), and its absence by a white marker. Missing data (i.e. species for which we were unable to obtain tissue) are indicated with a grey marker with grey outline. Mismatches between intact ORFs and transcripts, or between transcripts and protein data are indicated by an inequality symbol. Note: OPN1SW protein assays for P. quadridens revealed polymorphisms within the sample, and we recorded positive OPN1SW assays in some P. poeyi individuals despite an apparent disrupted ORF. Finally, a grey marker with no outline indicates the failure of protein assay for some species represented by museum specimens (Tadarida brasiliensis, Phyllostomus hastatus, Sturnira tildae, Sturnira ludovici, Platyrrhinus dorsalis and Chiroderma villosum).

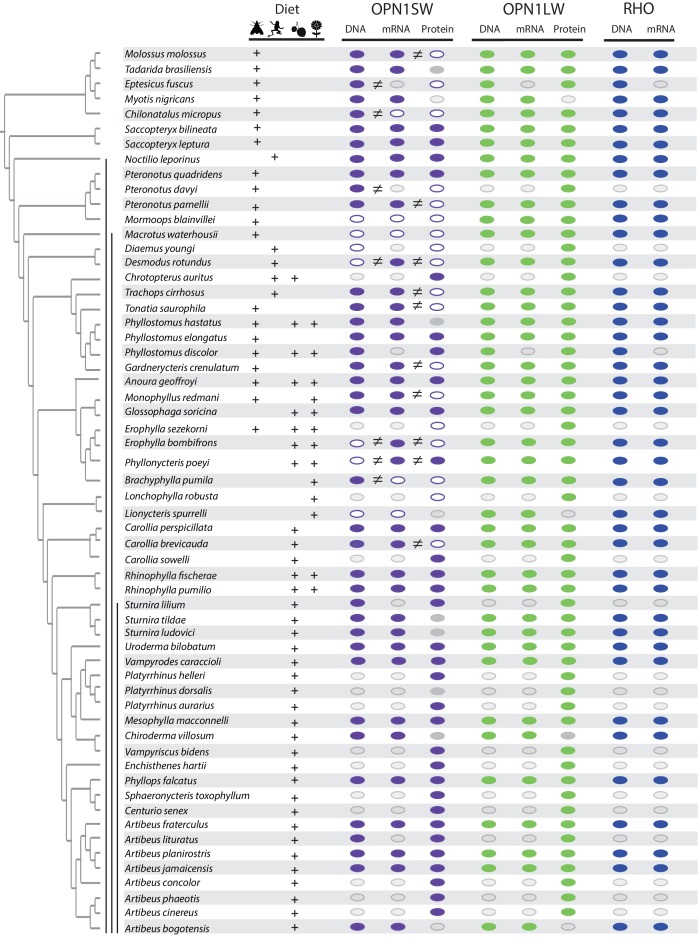
Figure 1.

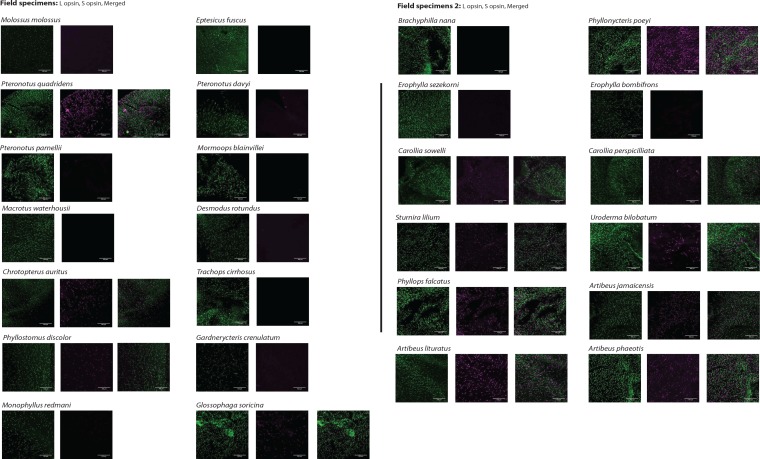
Figure 1—figure supplement 1. L- and S-opsin protein expression in the L- and S-cones of field samples.

Figure 1—figure supplement 1.

L- and S-opsin presence was assayed by IHC on field samples for 26 species with antibodies recognizing each of L- and S-opsin. For each species, L- and S-cone labeling are shown. For species with both L- and S-cones, the merged column is the result of the merged images of L- and S-cones from the same individual. No evidence of dual cones was found. Scale bar: 100 μm.
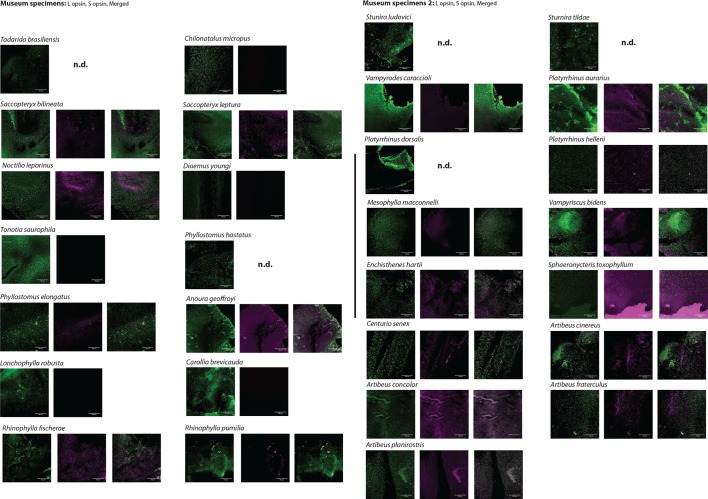
Figure 1—figure supplement 2. L- and S-opsin protein expression in the L- and S-cones of museum samples.

Figure 1—figure supplement 2.

L- and S-opsin presence was assayed by IHC on museum samples for 29 species with antibodies recognizing each of L- and S-opsin. For each species, L- and S-cone labeling are shown. For species with both L- and S-cones, the merged column is the result of the merged images of L- and S-cones from the same individual. No evidence of dual cones was found. Scale bar: 100 μm.
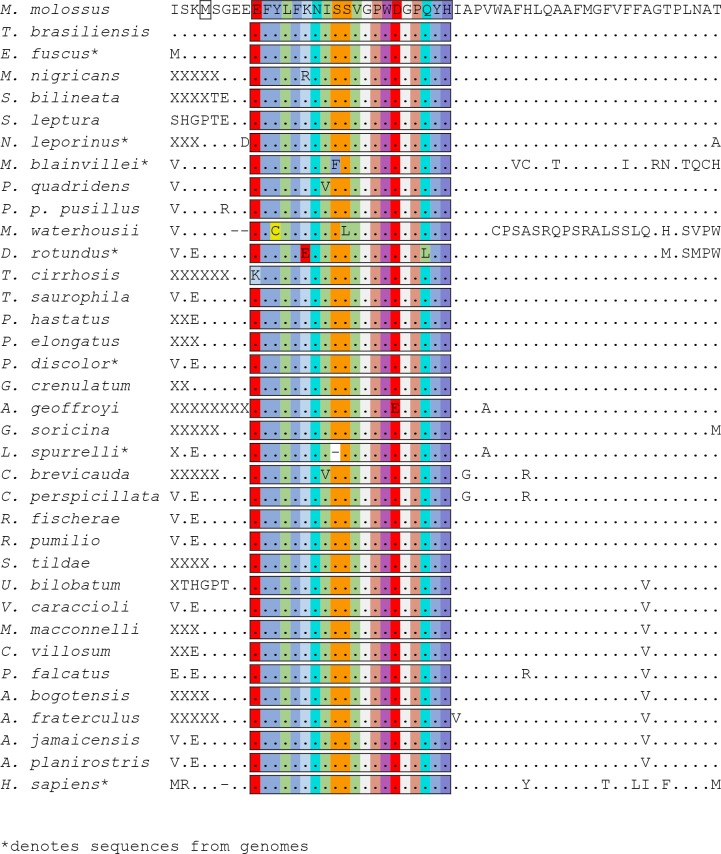
Figure 1—figure supplement 3. Partial amino acid alignments for OPN1SW across the bat species studied.

Figure 1—figure supplement 3.

For OPN1SW, the putative alternative start codon is indicated by the square box. Missing data is indicated by ‘X’. conserved amino acids by ‘.’, and the terminal STOP codon by ‘*’.
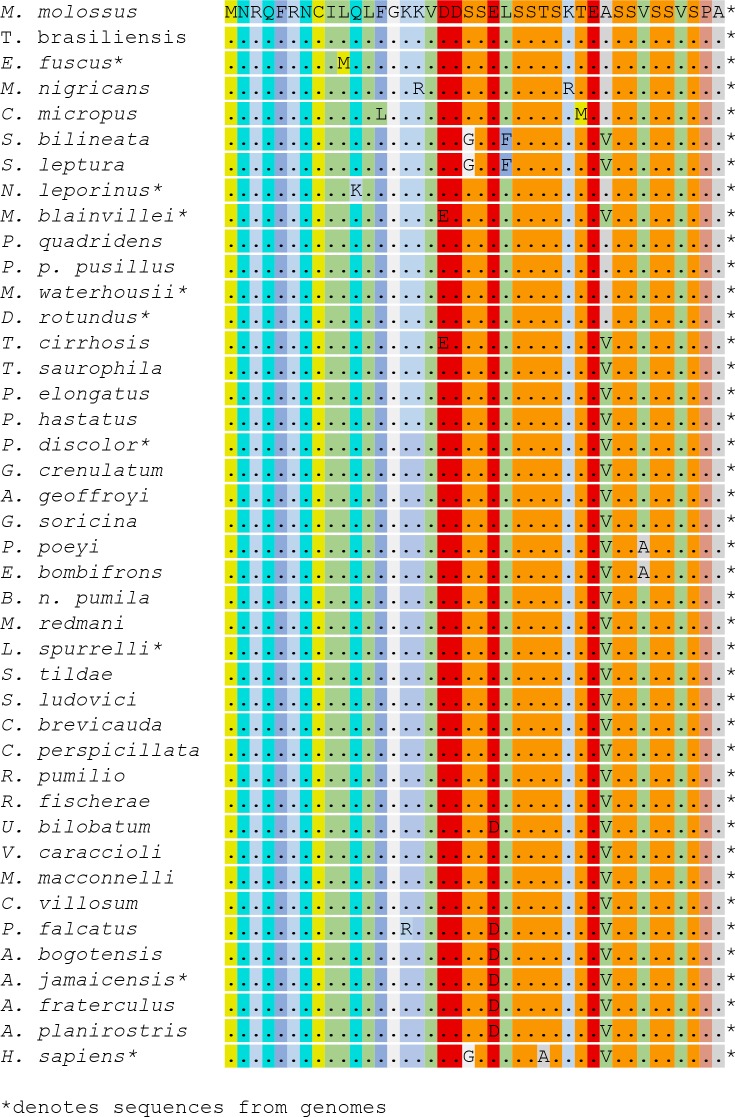
Figure 1—figure supplement 4. Partial amino acid alignments for OPN1LW across the bat species studied.

Figure 1—figure supplement 4.

Missing data is indicated by ‘X’. conserved amino acids by ‘.’, and the terminal STOP codon by ‘*’.
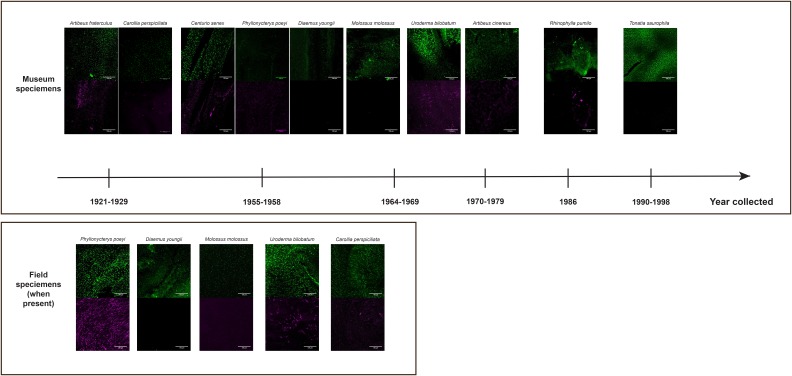
Figure 1—figure supplement 5. L- and S-opsin protein expression in L- and S-cones visualized in museum specimen of various ages (from 1921 to 1998) showing the consistency of the staining in old specimens.

Figure 1—figure supplement 5.

For some of these samples, some fresh specimens that have been assayed are shown, demonstrating the consistency of the staining between field and museum specimens. For each species, L- and S-cone labeling are represented by the following colors: L-opsins – green and S-opsins – purple. Scale bar: 100 μm.