Figure 2.

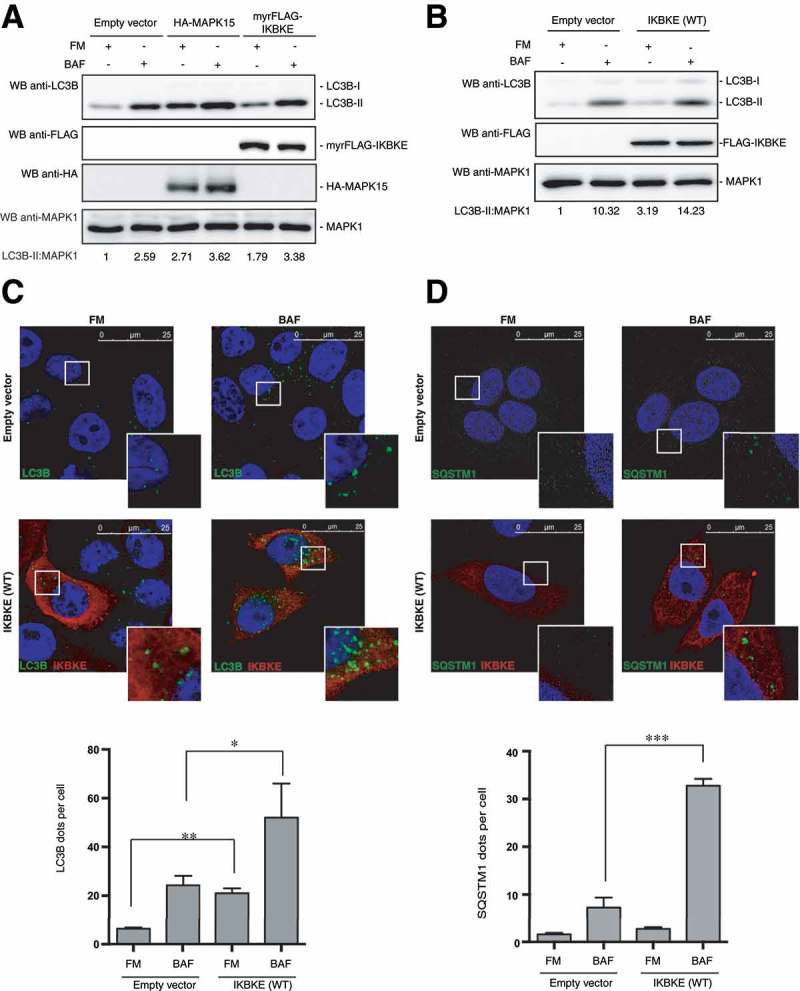
The IKBKE human oncogene induces autophagy. (a) WB analysis to evaluate autophagic flux of HeLa cells upon myrFLAG-IKBKE overexpression. Transfection with an empty vector was used as a negative control. Transfection with HA-MAPK15 was used as a positive control. Where indicated, 1 h treatment with 100 nM BAF was performed. Densitometric analysis of LC3B-II levels, normalized by the corresponding MAPK1 levels, is also shown. Results from one experiment, representative of 3 independent experiments (n = 3) are shown. (b) WB analysis to evaluate autophagic flux of HeLa cells upon IKBKE (WT) overexpression. Transfection with an empty vector was used as a negative control. Where indicated, 1 h treatment with 100 nM BAF was performed. Densitometric analysis of LC3B-II levels, normalized by the corresponding MAPK1 levels, is also shown. Results from one experiment, representative of 3 independent experiments (n = 3) are shown. (c) Confocal microscopy analysis of HeLa cells, to evaluate autophagic flux upon IKBKE (WT) overexpression. HeLa cells, stably expressing the indicated plasmids (empty vector and IKBKE [WT]), were subjected to immunofluorescence analysis. Where indicated, 1-h treatment with 100 nM BAF was performed. In these representative images, LC3B is visualized in green, IKBKE (WT) in red, and DAPI-stained nuclei in blue. LC3B-positive dots were counted using a specific protocol by Volocity software (see graph in the lower panel). Scale bars: 25 μm. Results from one experiment, representative of 3 independent experiments (n = 3) are shown. (d) Confocal microscopy analysis of HeLa cells, to evaluate autophagic flux upon IKBKE (WT) overexpression. HeLa cells, expressing the indicated plasmids (Empty vector and IKBKE [WT]), were subjected to immunofluorescence analysis. Where indicated, 24 h treatment with 100 nM BAF was performed. In these representative images, SQSTM1 is visualized in green, IKBKE (WT) in red, and DAPI-stained nuclei in blue. SQSTM1-positive dots were counted using a specific protocol by volocity software (see graph in the lower panel). Scale bars: 25 μm. Results from one experiment, representative of 3 independent experiments (n = 3) are shown.
