
Figure 4.
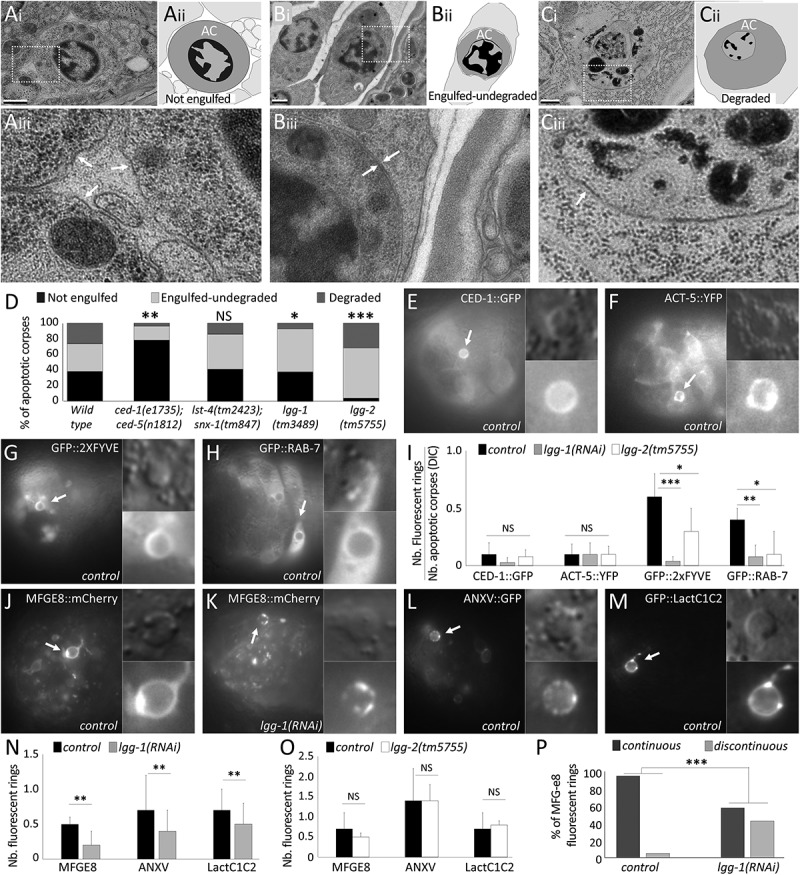
lgg-1 but not lgg-2 is involved in phosphatidylserine exposure on AC. (a to c) Transmission electron microscopy images of cell corpses in embryos and their corresponding schematic representations (aii,bii,cii). aiii, biii, ciii are 3-fold magnifications of the boxed areas showing the membranes surrounding asc (white arrows). Not engulfed asc (a) are easily detected, presenting a dark nucleus, a single surrounding membrane and spaces between neighboring cells. Undegraded-engulfed asc (b) are surrounded by 2 membranes, the cell corpse membrane and the phagosomal membrane. Degraded asc (c) are irregular with a disorganized nucleus and one single surrounding membrane. Scale bar: 0.5 µm. (d) Quantification of the percentages of the 3 categories of asc in the wild-type as well as in the ced-1;ced-5 phagocytosis mutant (n = 45), lst-4;snx-1 lysosomal fusion mutant (n = 29), lgg-1 (n = 27) and lgg-2 (n = 47) mutant embryos. Fisher test analysis of the distribution of the 3 classes * P value < 0.07, ** P value < 0.005, *** P value < 0.0005. (e to h) Epifluorescence images of embryos expressing the GFP reporters of AC phagocytosis CED-1::GFP (e), ACT-5::YFP (f), GFP::2XFYVE (g) and GFP::RAB-7 (h). Arrows indicate cell corpse positive for the reporters and magnified in the insets. Scale bar: 10 µm. (i) Quantification of phagocytosis reporters expression levels in control, lgg-1(RNAi) and lgg-2 mutant embryos. Data represent the ratio between the number of GFP rings and the number of asc visible by DIC. Error bars represent the standard deviation (n ≥ 10). Wilcoxon Mann-Whitney test analysis * P value < 0.05, ** P value < 0.005, *** P value < 0.0005. (j to m) Epifluorescence images of PS fluorescent sensor reporters MFG-e8::mCherry (J,K), ANX::GFP (l) and GFP::Lact (m) in wild-type (j,l,m) and lgg-1(RNAi) (k) embryos. Fluorescent asc indicated by arrows are magnified in insets. (n and o) Quantification of PS fluorescent reporter recruitment in control, lgg-1(RNAi) or lgg-2 mutant (o) embryos. Data represent the ratio between the number of fluorescent rings and the number of asc as determined by DIC. Error bars represent the standard deviation (n ≥ 10). Wilcoxon Mann-Whitney test analysis * P value < 0.05, ** P value < 0.005. (p) Percentage of asc labelled by MFG-e8 with a continuous or discontinuous fluorescent ring in control and lgg-1(RNAi) embryos. n ≥ 30 cell corpses, Fisher test analysis *** P value < 0.0005.