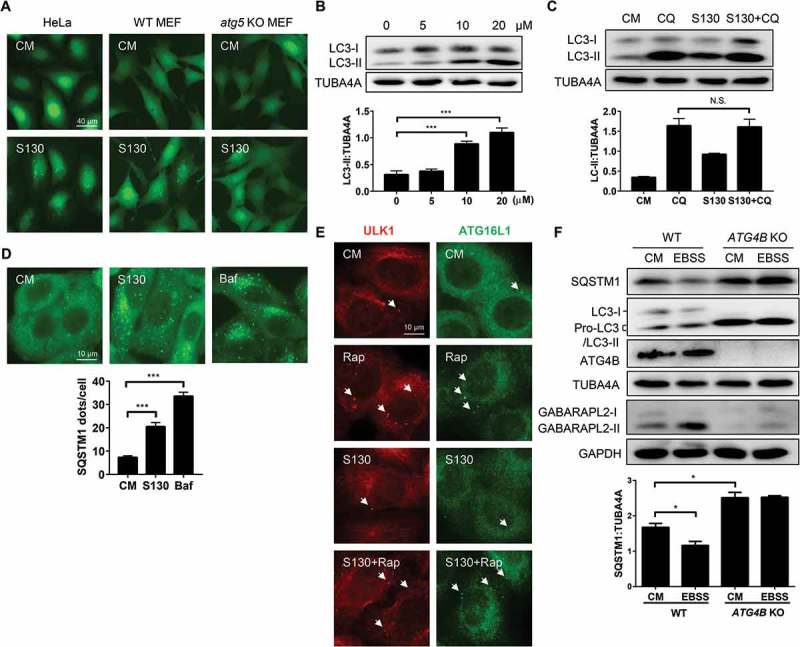
Figure 3.

S130 inhibits autophagic flux without affecting the initiation steps of autophagy. (A) HeLa, WT MEFs and atg5 KO MEFs expressing GFP-LC3 were treated with complete medium (CM) or S130 (10 μM) for 6 h. The distribution of GFP-LC3 was examined. (B) HeLa cells treated with 0–20 μM of S130 for 6 h were analyzed by immunoblot. The ratio of LC3-II:TUBA4A was calculated based on the band density. (C) HeLa cells treated with S130 (10 μM) for 6 h in the presence or absence of CQ (40 μM) as indicated were analyzed by immunoblot. The ratio of SQSTM1:TUBA4A and LC3-II:TUBA4A was calculated based on the band density. (D) HeLa cells were treated with S130 (10 μM) or Baf (0.5 μM) for 6 h and the accumulation of SQSTM1 was measured by immunostaining. The number of SQSTM1-positive dots was quantified. (E) HeLa cells were treated with S130 (10 μM) or/and Rap (1 μM) for 6 h, followed by immunostaining of the early stage marker of autophagy, ATG16L1 and ULK1. (F) Immunoblot analysis of WT HeLa or ATG4B KO HeLa cells cultured in CM or starvation medium (EBSS) for 2 h. The bands in ATG4B KO HeLa cells indicate the pro-LC3. The ratio of SQSTM1:TUBA4A was calculated. Data are presented as mean ± SEM from 3 individual experiments. ***P < 0.001, NS, not significant. Arrows indicate ATG16L1- or ULK1-positive structures.
