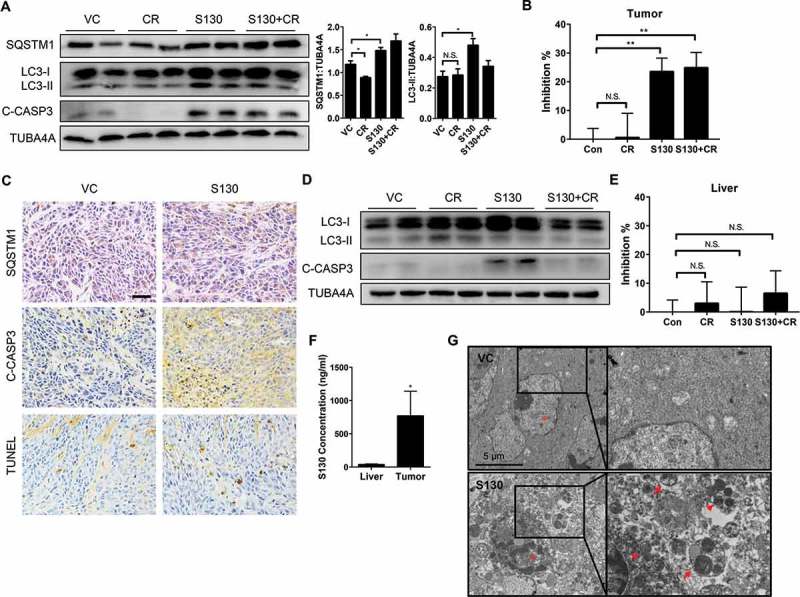
Figure 8.

S130 inhibits ATG4B activity of tumor tissue instead of liver tissue. (A) Immunoblot analysis of tumor tissues treated with VC, CR, S130, and S130 plus CR as in Figure 7. The protein level of SQSTM1 and LC3-II was analyzed. (B) Quantitative analysis of the ATG4 activity of different tumor tissues by FRET assay. (C) Tumor tissues were sectioned and subjected to TUNEL assay and immunohistochemical staining for SQSTM1 and cleaved CASP3. Scale bar: 50 µm. (D) Immunoblot analysis of mice liver tissues from different groups as in (A). (E) Quantitative analysis of the ATG4 activity of different liver tissues by FRET assay. (F) In vivo distribution of total S130 in the liver and tumor tissues from VC and S130 groups as shown in Figure 7 was determined. Data are presented as mean ± SD, *P < 0.05. (G) TEM analysis of the ultrastructure of the representative tumor tissues. Red arrows indicate autolysosomes and red arrowheads indicate mitochondria. Data are presented as mean ± SEM from 3 individual experiments. N.S., not significant, **P < 0.01.
