Figure 1.

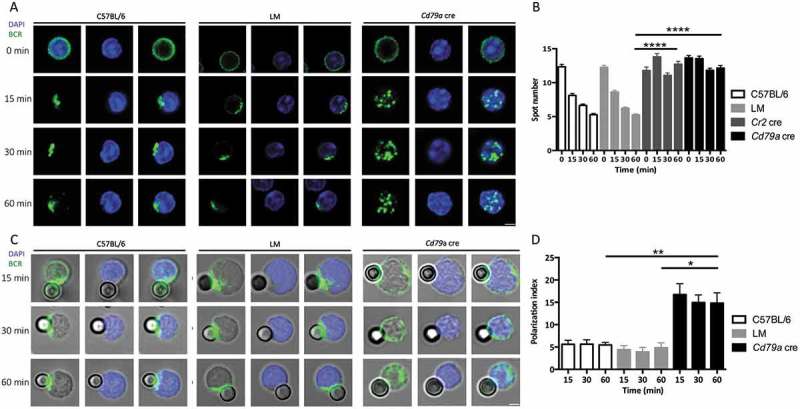
ATG5 participates in BCR clustering and polarization. (a) Representative images obtained for the analysis of BCR localization after various times of stimulation (T = 0; 15; 30; 60 min) with a soluble anti-mouse IgM in control (C57BL/6 and LM) or Atg5-cKO (Cd79a cre) B cells. Images taken with x63 objective on a confocal setup. (b) Quantification of the amount of BCR spots detected after stimulation in control (C57BL/6 and LM) or Atg5-cKO (Cr2 cre and Cd79a cre) B cells, at various time points after BCR engagement. Bars represent mean values per cell ±SEM; ****P < 0.0001 Student t test, N = 100 cells. (c) Representative images obtained for the analysis of BCR localization after various stimulation times with beads conjugated to anti-mouse IgM (T = 15; 30; 60 min) in control (C57BL/6 and LM) or Atg5-cKO (Cd79a cre) B cells. Images were taken with x63 objective on a confocal setup. (d) Polarization index of the BCR after stimulation in control (C57BL/6 and LM) or Atg5-deficient (Cr2 cre and Cd79a cre) B cells with beads conjugated with anti-mouse IgM. This index is the relative angle formed between the center of mass of the cell and the extremes of the staining distribution. Bars represent mean values per individual experiment ±SEM; **P < 0.001, *P < 0.01 Mann-Whitney U test. N = 5, no statistical difference between control mice (C57BL/6 and LM) were revealed. Scale bar: 2 µm.
