
Figure 2.
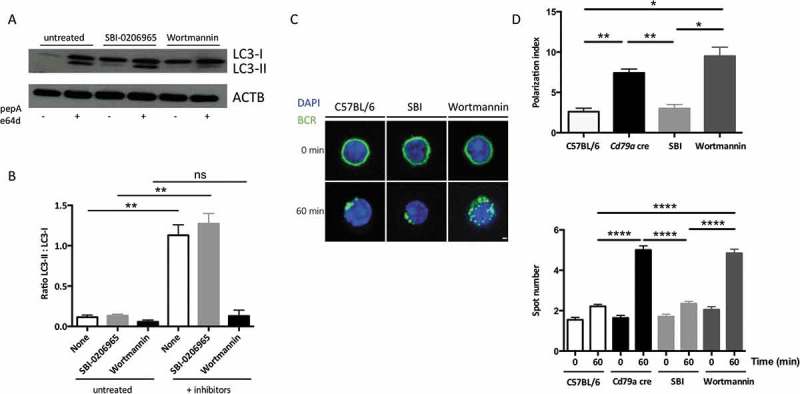
BCR clustering depends on PtdIns3K activity. (a) Immunoblot showing LC3 expression in purified B cells isolated from C57BL/6 mice at steady state or after treatment with the ULK1 inhibitor SBI-0206965, or wortmannin for 3 h. Lysosomal protease inhibitors pepstatin A and E64d were added (+) or not (-) for 4 additional hours in the culture to monitor autophagic flux. ACTB staining was used as a loading control. (b) Histograms representing LC3-II:LC3-I staining intensity ratios in 4 independent experiments performed. Means are shown, and errors bars stand for SEM, **P < 0.01 Mann-Whitney U test, N = 4. (c) Representative images obtained for the analysis of BCR localization before and after 60 min stimulation with a soluble anti-mouse IgM in B cells isolated from C57BL/6 or CD79a cre mice, after treatment with the ULK1 inhibitor SBI-0206965, or wortmannin, for 3 h. Representative images taken with x100 objective are shown. (d) BCR polarization index and spot numbers after stimulation in conditions described in (b). The polarization index is the relative angle formed between the center of mass of the cell and the extremes of the staining distribution (Bars represent mean values per individual experiments ±SEM; ****P < 0.0001, **P < 0.01, *P < 0.05 Student test and Mann-Whitney U test. N = 100 and N = 5 respectively. Scale bar: 2 µm.