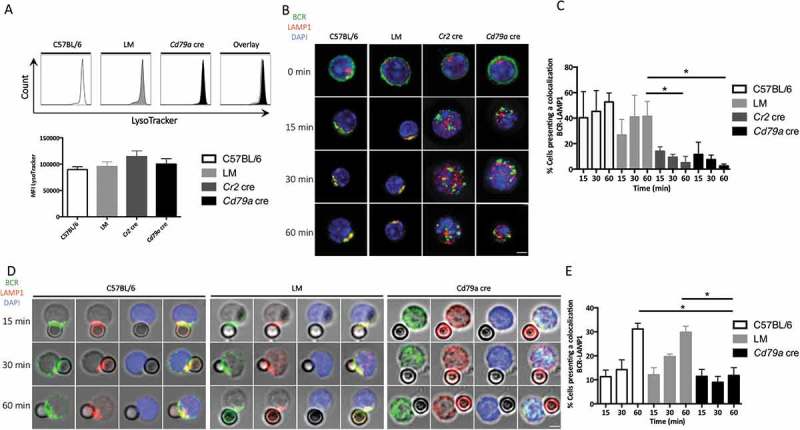
Figure 4.

ATG5 participates in the recruitment of LAMP1+ compartments to the immune synapse. (a) Evaluation of lysosomal load in spleen B cells (PTPRC/B220+ and TCRB−) by LysoTracker Deep-Red staining from control (C57BL/6 and LM) and Cd79a cre mice, analyzed by flow cytometry. Representative histograms are shown for each genotype. Summary of mean fluorescence intensities (MFI) obtained on 5 independent mice is shown in histograms. Error bars show SEM. N = 5. (b) Representative images obtained for the analysis of BCR-LAMP1 colocalization after BCR engagement with a soluble anti-IgM antibody at indicated times (T = 0; 15; 30; 60 min) in control (C57BL/6 or Littermate) and ATG5-deficient (Cr2 cre and Cd79a cre) B cells. Images were taken with x63 objective on a confocal setup. (c) Histogram representing quantification of BCR-LAMP1 colocalization in control (C57BL/6) or ATG5-deficient B cells at various time points after BCR engagement with a soluble anti-IgM antibody (T = 15; 30; 60 min). The percentage of colocalization was determined by considering the percentage of cells presenting a Pearson correlation coefficient between 0.5 and 1. Bars represent mean values ±SEM; *P < 0.05 Mann-Whitney U test. N = 3. (d) Representative images obtained for the analysis of BCR-LAMP1 colocalization after various times of BCR engagement by anti-IgM beads (T = 15; 30; 60 min) in B cells from control (C57BL/6, LM) mice or ATG5-deficient B cells (Cd79a cre). Representative cells from 4 independent experiments are shown. Images were taken with x63 objective on a confocal setup. (e) Quantification of BCR-LAMP1 colocalization in control (C57BL/6 and LM) or ATG5-deficient (Cd79a cre) B cells after BCR engagement with a soluble anti-IgM antibody at various time points (T = 15; 30; 60 min). The percentage of colocalization was determined by considering the percentage of cells presenting a Pearson correlation coefficient between 0.5 and 1. Bars represent mean values ±SEM; *P < 0.05 Mann-Whitney U test. N = 4 (C57BL/6), 3 (LM), and 4 (Cd79a cre), no statistical difference between control mice (C57BL/6 and LM) were revealed. Scale bar: 2 µm.
