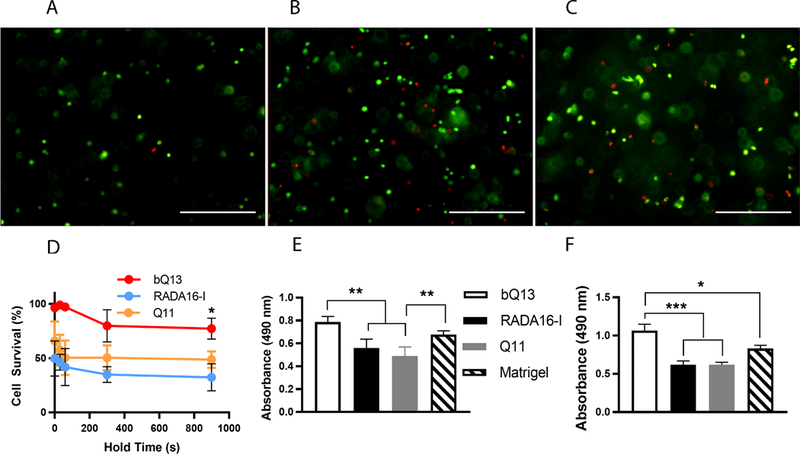
Figure 3.

Survival of LNCaP cells after encapsulation in peptide gels. Representative live/dead staining (A-C) of LNCaP cells within bQ13 (A), RADA16-I (B), and Q11 (C) after incubating the cells in the peptide precursors for 300 sec before neutralization/gelation in media. Scale bars = 400 μm. D) Cell survival for cells suspended in ungelled precursors of bQ13, RADA16-I, and Q11 for variable amounts of time (hold time, indicated) and then subsequently gelled by pipetting into media. E) Metabolic activity (MTS assay) of LNCaP cells cultured for 24 hours in various matrices. F) Metabolic activity (MTS assay) of cells cultured for 7 days. *p<0.05, **p<0.01, ***p<0.001 by ANOVA with Tukey’s post-hoc test. Means +/− s.e.m. shown. n=4 experimental replicates per group.
