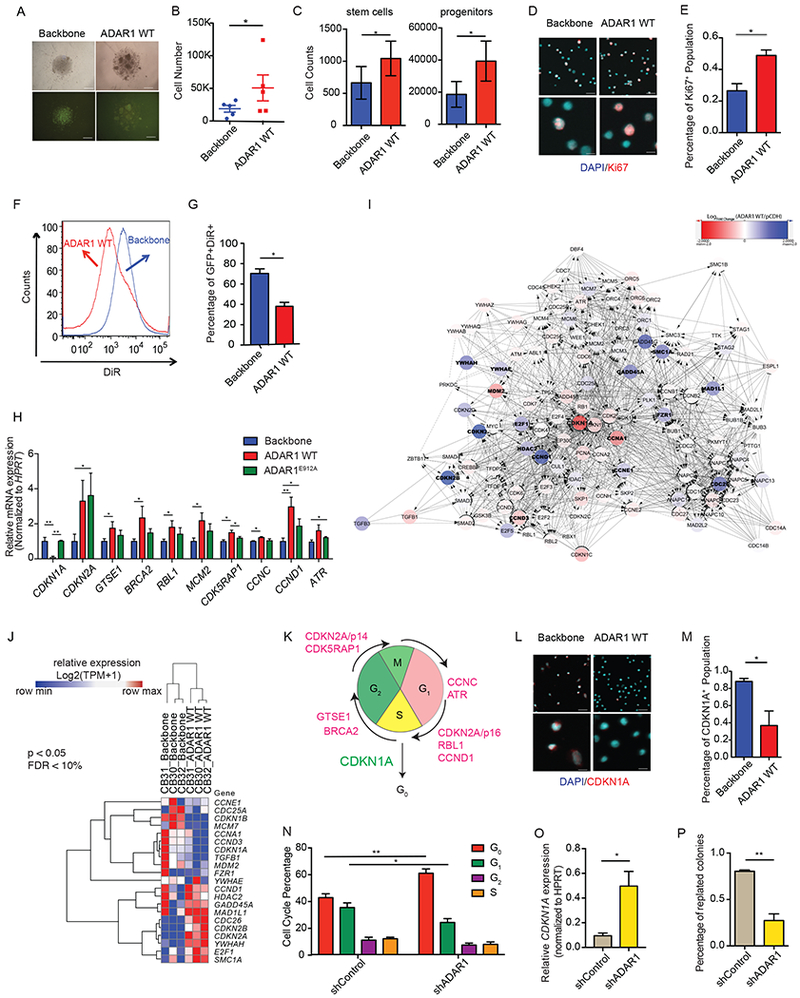
Figure 1. ADAR1 regulates cell cycle in normal hematopoiesis.

(A) Representative picture of ADAR1-WT or lentiviral backbone transduced cord blood CD34+ cells. (B and C) Cell counts of total cell number (B), stem cells (CD34+CD38−Lin−), and progenitors (CD34+CD38+Lin−) (C) following ADAR1 WT overexpression in cord blood CD34+ cells (n=3). (D and E) Representative image of Ki67 immunofluorescent staining in ADAR1 WT-expressing cord blood CD34+ cells (D) and the corresponding calculation of Ki67+ cells (n=3). (F and G) Representative flow cytometry of DiR tracing in cord blood CD34+ cells transduced with backbone control or ADAR1 WT (F) and the corresponding calculation of GFP+DiR+ cells (G) (n=3). (H) Significant differential expressed cell cycle transcripts were determined by qRT-PCR array of 84 transcripts on cord blood HSPC (n=5) transduced with ADAR1 WT, ADAR1E912A, or lentiviral vector control. (I) Cytoscape analysis of differentially expressed transcripts of KEGG Cell Cycle Pathway in ADAR1 WT-transduced cord blood (n=3) versus lentiviral vector control (n=3) by whole transcriptome RNA-seq. (J) RNA-seq quantification on ADAR1 WT-transduced cord blood (n=3) and lentiviral vector control (n=3) for genes corresponding to the KEGG Cell Cycle Pathway visualized in a heatmap (p<0.05, FDR <10%). (K) Representative image of ADAR1-mediated differentially expression targets in cell cycle stages. (L and M). Representative images (L) and quantification (M) of immunofluorescent staining of CDKN1A protein in ADAR1 WT-expressing CD34+ cells (n=3). (N) Cell cycle analysis in cord blood CD34+ HSPC transduced with shRNA targeting ADAR1 (shADAR1) or control shRNA (shControl) as measured by flow cytometry of Ki-67 and 7AAD (n=4). (O). CDKN1A expression measured by qRT-PCR in cord blood CD34+ HSPC (n=3). (P) Percentage of replated colonies in cord blood CD34+ HSPC transduced with shADAR1 or shControl (n=3). All graphs show mean with SEM and statistical analysis was calculated using the Student’s t-test. *p<0.05, **p<0.005, ***p<0.0005. See also Figure S1 and Table S1.
