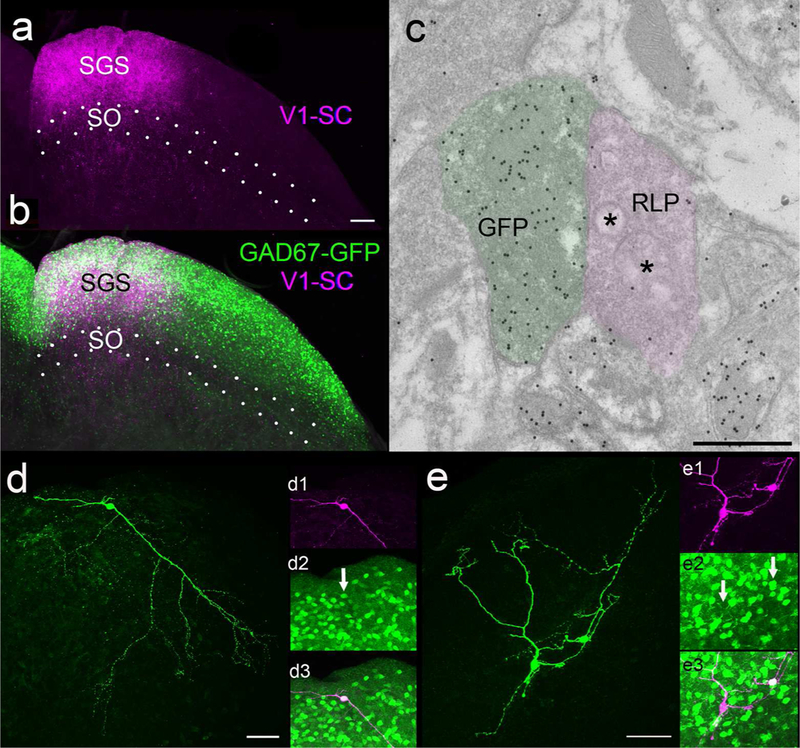
Figure 1:

A) Virus injections in V1 labeled terminals in the stratum griseum superficiale (SGS, A, purple) which overlapped the distribution of cells that contain green fluorescent protein (GFP, B, green) in the GAD67-GFP mouse line. C) Electron microscopic examination of SGS tissue from GAD67-GFP mice stained with a GABA antibody tagged with gold particles revealed a high density of gold particles overlying GFP-labeled profiles (green overlay) and a low density overlying large profiles with round vesicles and pale mitochondria (RLP profiles, purple overlay). D) Example of a biocytin-filled GFP+ neuron (green). D1) The neuron illustrated in D pseudocolored purple. D2) GFP label in the biocytin-filled cell (arrow). D3) Biocytin and GFP are contained in the same cell (white). E) Examples of a biocytin-filled GFP+ and GFP- neurons (green). E1) The neurons illustrated in E pseudocolored purple. E2) GFP label in the upper, but not the lower biocytin-filled cell (arrows). E3) Biocytin and GFP are contained in the upper (white) but not the lower cell (purple). Scale in A = 100 μm and applies to B, Scale in C = 600 nm, Scale in D = 50 μm and applies to D1-D3. Scale in E = 50 μm and applies to E1-E3.
