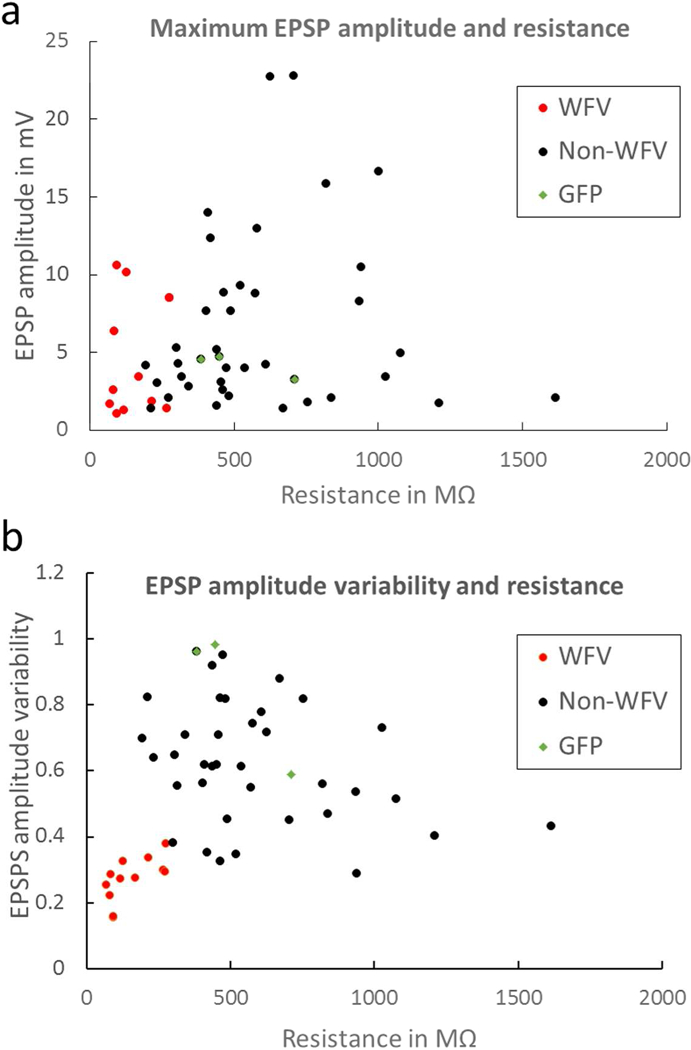
Figure 6:

A) The maximum EPSP amplitudes recorded (in response to a single pulse within a train, data from both C57BL/6J and GAD67-GFP mice) in WFV cells (red dots), non-WFV cells (black dots), and GFP+ cells (green diamonds), plotted as a function of input resistance. B) The variability in EPSP amplitudes (standard deviation, see text for details) plotted as a function of input resistance for WFV cells, non-WFV cells, and GFP+ cells. WFV cell response amplitudes were the least variable.
