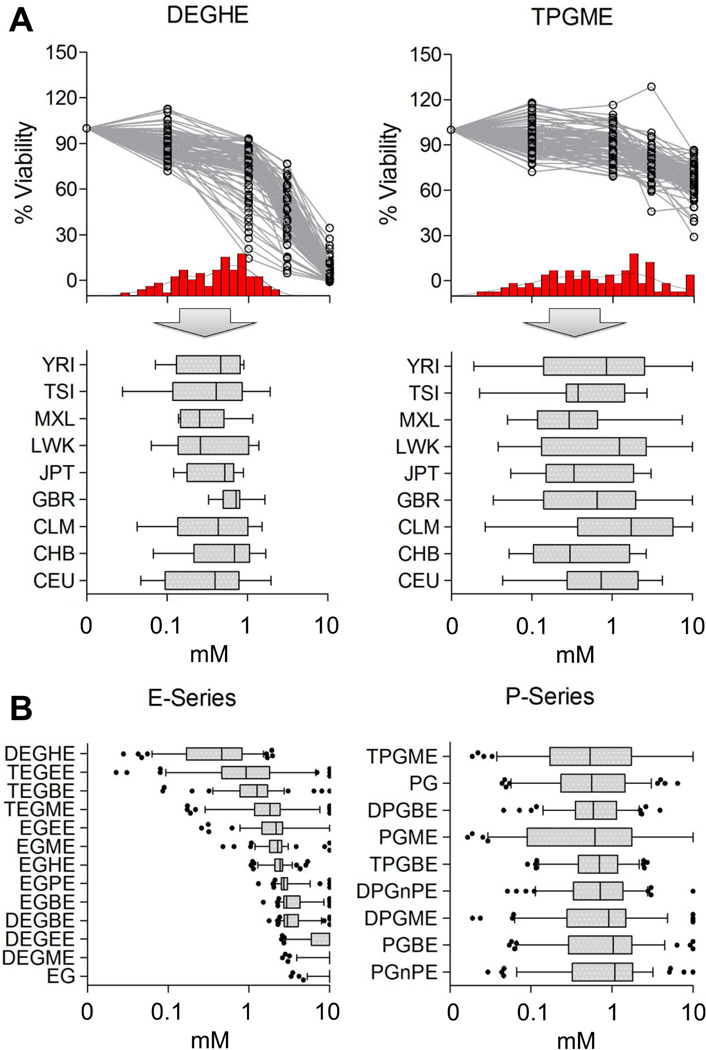
Figure 4.

Population variability assessment of E-Series and P-Series glycol ethers in human lymphoblast cell lines. Panel A provides an overview of the distribution of calculated Point-of-Departure (POD) values for each one selected E-Series (DEGHE) and P-Series (TPGME) glycol ether across all tested cell lines (n=94). Individual concentration response plots and relative frequency distribution of calculated point-of-departure (POD) values (red inserts) are shown in the top part, the POD frequency distribution for all nine tested donor populations is shown on the bottom. Panel B highlights the distribution of POD values for both E-Series and P-Series glycol ethers across all populations. Individual box and whisker plots indicate the median and span across the 5–95 percentile. Statistical outliers are depicted as individual dots. Abbreviations: CEU=Utah residents with European Ancestry (n=13); CHB=Han Chinese from Beijing, China (n=14); CLB=Colombians from Medellin, Colombia (n=11); GBR=British from England and Scotland (n=9); JPT=Japanese from Tokyo, Japan (n=10); LWK=Luhya from Webuye, Kenya (n=8); MXL=Los Angeles residents with Mexican Ancestry (n=10); TSI=Tuscans from Italy (n=12); YRI=Yoruba from Ibadan, Nigeria (n=11).
