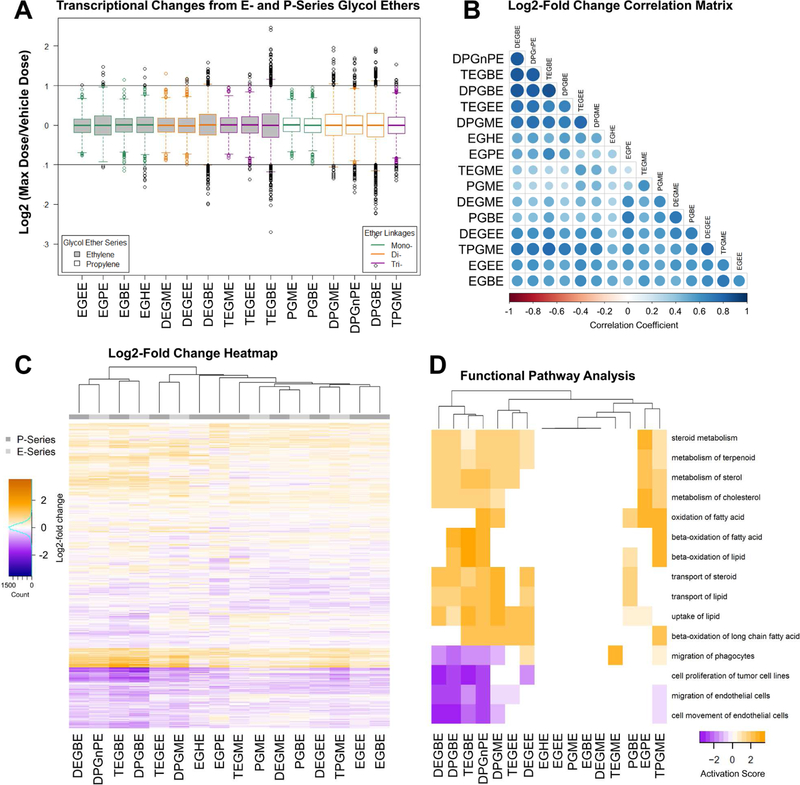
Figure 5.
TempO-seq Gene Expression. P- and E-series glycol ethers were assessed via TempO-seq for expression of 1616 genes. Counts were normalized with DESeq2, and expression ratios computed (10mM treated counts / vehicle treated counts). The data were then visualized in the following ways: (A) Boxplots of absolute log2(ratio), (B) correlation matrix of the log2(ratio); the magnitude of these values are visualized in the lower triangular region using circle size/color combinations, and (C) heatmap of log2(ratio). Functional Pathway Analysis (D) using expression log2(ratio) were analyzed for dose-response association. A clustered heatmap (average linkage) is shown for the top 15 disease and biological functions. Negative scores indicate pathway downregulation, positive scores are associated with functional pathway induction.

