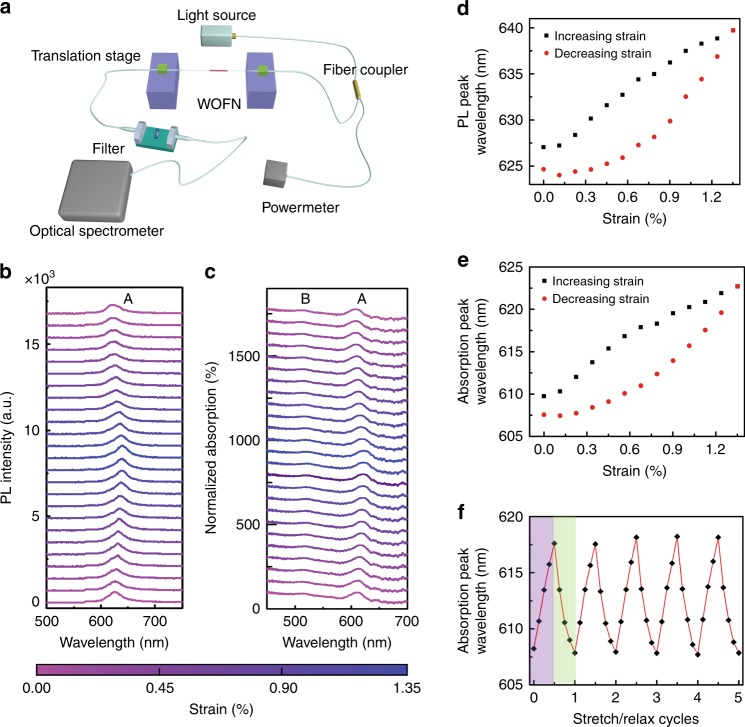
Fig. 3. Strain manipulation of the PL and absorption spectra of the WOFN.
a Experimental set-up for the in-waveguide tuning of the PL spectra of WS2 in the WOFN. The translation stage is used to apply a uniaxial strain on the WOFN. Variations of the b PL spectra and c absorption spectra of the WOFN with an increase and decrease in the strain. The curves from bottom to top correspond to the sequence of data acquisition. For clarity, the curves in b are vertically shifted by multiples of 700, while those in c are shifted by multiples of 70%. Variations of the d PL peak wavelength and e absorption peak wavelength in the A exciton region with the increase and decrease in the strain. f Dependence of the absorption peak wavelength of the WOFN during strain loading and unloading. The violet region corresponds to the increase in the strain, while the green region corresponds to the decrease in the strain. One cycle contains four steps of strain loading/unloading; each step corresponds to a strain of 0.22%

