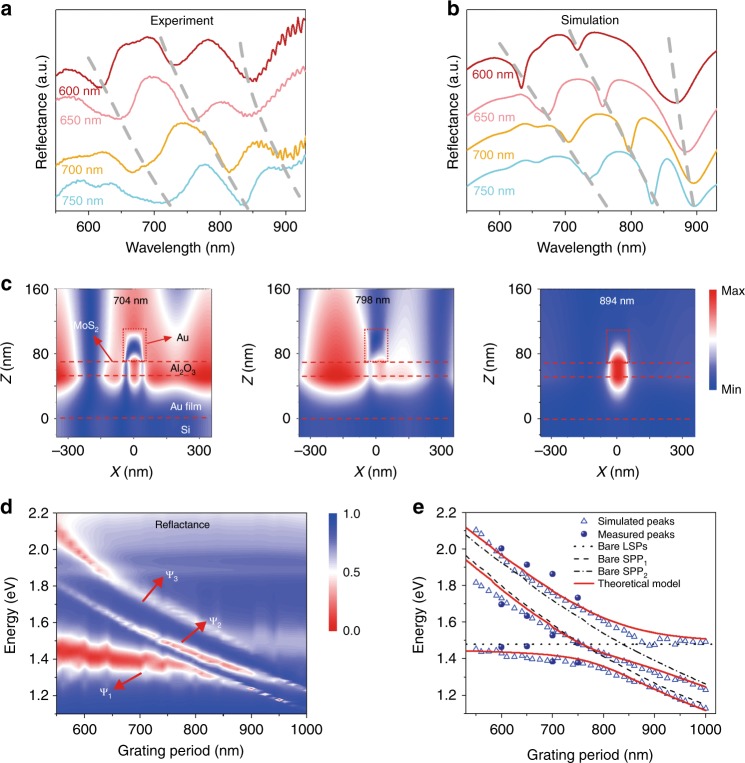
Fig. 2. Steady-state reflectance spectra of the sandwiched heterostructures.
a Measured reflectance spectra of the Au grating/MoS2/substrate with grating periods of 600, 650, 700, and 750 nm. b Simulated reflectance spectra of the corresponding samples in (a). c Simulated magnetic field distribution at the resonances for the sample with a 700 nm grating period. d The simulated grating-period-dependent reflectance of the sandwiched structures, which exhibits classic Rabi splitting. Ψi (i = 1, 2, 3) are eigenstates of the Hamiltonian. e Simulated (hollow triangles), measured (filled dots), and theoretical (solid lines) resonance energies as a function of the grating period. The dotted line shows the constant dispersion relation of the uncoupled localized surface plasmons, while the dashed and dash-dotted lines denote the dispersions of the uncoupled SPPs propagating along the –x (SPP1) and +x (SPP2) axes, respectively. SPP surface plasmon polariton

