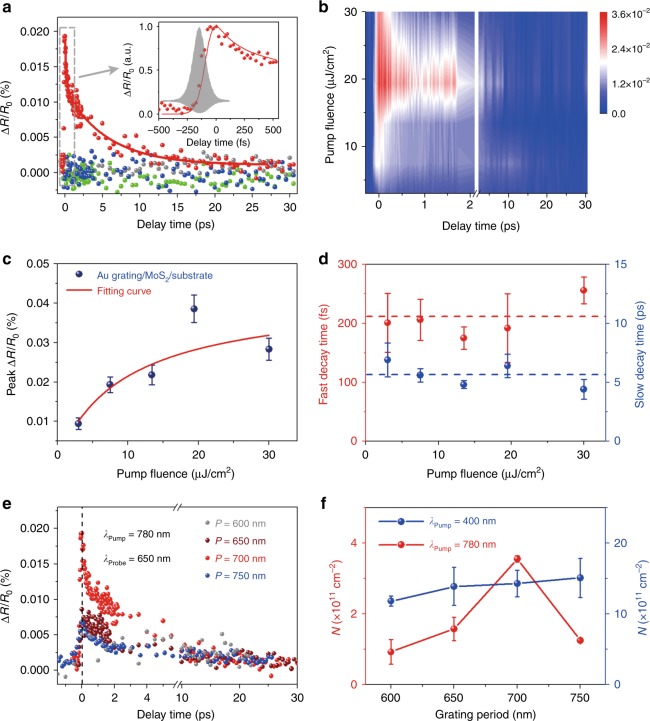
Fig. 3. Transient absorption spectra of the heterostructures for different grating periods and pump wavelengths.
a Differential reflection spectra of the Au grating/MoS2/substrate (red dots) and control samples of the Au grating, MoS2 monolayer and substrate for a pump fluence of 7.5 μJ/cm2. The red line is a fitting curve for the descent of ΔR/R0(t) with a biexponential function. The inset shows details of the rising process with normalization. The data shown in gray represent the interferometric autocorrelation function for the pump pulses, from which the upper envelope with a full width at half-maximum of ~130 fs is taken as the IRF. The red line in the inset was obtained by convoluting the IRF and the actual electron injection function. b Pump-fluence-dependent transient absorption spectra of the heterostructure. The scale bar corresponds to the intensity of the ultrafast signals. c The maximum amplitude of ΔR/R0(t) as a function of pump fluence. The red line is a fitting curve with the saturation formula of Eq. (4). d Fast and slow decay lifetimes varying with pump fluence. e Ultrafast pump-probe spectra of the Au grating/MoS2/substrate for different grating periods pumped at 780 nm with 7.5 μJ/cm2. f Excited (injected) electron densities derived from the peak amplitudes of ΔR/R0(t). The red dots represent the grating-period-dependent densities of electrons injected into the MoS2 monolayer pumped at 780 nm, while the blue dots correspond to the densities of electrons excited directly at the pump wavelength of 400 nm. IRF instrument response function

